03_SeqFISH+_fibroblast_cell_line
1_dataset details
| Dataset | Cell number | Gene number | Graph | Pattern |
|---|---|---|---|---|
| seqfish_fibroblast | 171 | 2747 | —— | —— |
| seqfish_fibroblast(part) | 171 | 60 | 8068 | 3 seqfish+ original study |
seqfish_fibroblast中的 60 个gene为:
| Pattern | Gene set |
|---|---|
| Nuclear or nuclear edge | Col1a1, Fn1, Fbln2, Col6a2, Bgn, Nid1, Lox, P4hb, Aebp1, Emp1, Col5a1, Sdc4, Postn, Col3a1, Pdia6, Col5a2, Itgb1, Calu, Pdia3, Cyr61 |
| Cytoplasmic | Ddb1, Myh9, Actn1, Tagln2, Kpnb1, Hnrnpf, Ppp1ca, Hnrnpl, Pcbp1, Tagln, Fscn1, Psat1, Cald1, Snd1, Uba1, Hnrnpm, Cap1, Ssrp1, Ugdh, Caprin1 |
| Protrusion | Cyb5r3, Sh3pxd2a, Ddr2, Net1, Trak2, Kif1c, Kctd10, Dynll2, Arhgap11a, Gxylt1, H6pd, Gdf11, Dync1li2, Palld, Ppfia1, Naa50,Ptgfr, Zeb1, Arhgap32, Scd1 |
2_GRASP preprocessing
step1: Load data
dataset = "seqfish_fibroblast"
outfile = f'../1_input/pkl_data/{dataset}_data_dict.pkl'

with open(outfile, 'rb') as f:
    pickle_dict = pickle.load(f)

df_registered = pickle_dict['df_registered']
cell_radii = pickle_dict['cell_radii']
cell_boundary = pickle_dict['cell_boundary']
nuclear_boundary = pickle_dict['nuclear_boundary']
nuclear_boundary_df_registered = pickle_dict['nuclear_boundary_df_registered']
step2: Visualize the original and normalized TSGs
path = "../2_scaled_cell"

df_registered = df_registered[df_registered['gene']=='Cyb5r3']
cep.plot_raw_gene_distribution(dataset, cell_boundary, nuclear_boundary, df_registered, path)
Processing cells:   0%|          | 0/179 [00:00<?, ?it/s]
Processing cells: 100%|██████████| 179/179 [02:54<00:00,  1.02it/s]
All cell images have been saved to ../2_scaled_cell/seqfish_fibroblast/raw_gene/cell_9-16
step3: Statistical valid TSGs
cell_list = df_registered['cell'].unique()
gene_list = df_registered['gene'].unique()
print(f'{len(cell_list)} cells - {len(gene_list)} genes')

save_dir = f'../3_filter/{dataset}/'
if not os.path.exists(save_dir):
    os.makedirs(save_dir)

no_points_list = []
low_points_list = []

grouped = df_registered.groupby(['gene', 'cell'], observed=True).size().reset_index(name='num_points')
print(grouped)
gene_cell_count = df_registered.groupby('gene', observed=True)['cell'].nunique()
valid_genes = gene_cell_count[gene_cell_count >= 10].index
invalid_genes = gene_cell_count[gene_cell_count < 10].index

print("List of invalid genes (expressed in fewer than 10 cells):")
print(invalid_genes.tolist())

df_registered = df_registered[df_registered['gene'].isin(valid_genes)]
filtered_grouped = grouped[grouped['gene'].isin(valid_genes)]
print(filtered_grouped)

for _, row in tqdm(filtered_grouped.iterrows(), total=len(filtered_grouped), desc="Processing genes and cells"):
    gene = row['gene']
    cell = row['cell']
    num_points = row['num_points']

    if num_points == 0:
        no_points_list.append({'gene': gene, 'cell': cell})
    elif num_points < 10:
        low_points_list.append({'gene': gene, 'cell': cell})

pd.DataFrame(no_points_list).to_csv(f'{save_dir}/all_no_points_list.csv', index=False)
pd.DataFrame(low_points_list).to_csv(f'{save_dir}/all_low_points_list.csv', index=False)
171 cells - 2747 genes
                 gene  cell  num_points
0       5830417i10rik   0-0           5
1       5830417i10rik   0-1           6
2       5830417i10rik  0-11           9
3       5830417i10rik  0-12          21
4       5830417i10rik  0-14          11
...               ...   ...         ...
307043          Zzef1   9-1           5
307044          Zzef1  9-14           9
307045          Zzef1   9-4           5
307046          Zzef1   9-5           5
307047          Zzef1   9-8           5

[307048 rows x 3 columns]
List of invalid genes (expressed in fewer than 10 cells):
[]
                 gene  cell  num_points
0       5830417i10rik   0-0           5
1       5830417i10rik   0-1           6
2       5830417i10rik  0-11           9
3       5830417i10rik  0-12          21
4       5830417i10rik  0-14          11
...               ...   ...         ...
307043          Zzef1   9-1           5
307044          Zzef1  9-14           9
307045          Zzef1   9-4           5
307046          Zzef1   9-5           5
307047          Zzef1   9-8           5

[307048 rows x 3 columns]


Processing genes and cells: 100%|██████████| 307048/307048 [00:26<00:00, 11770.99it/s]
df_list = df_registered[['gene','cell']].copy()
print("raw df_list shape:", df_list.shape)
df_list_unique = df_list.drop_duplicates()
print("duplicate df_list shape:", df_list_unique.shape)

low_points_path = f'../3_filter/{dataset}/all_low_points_list.csv'
no_points_path = f'../3_filter/{dataset}/all_no_points_list.csv'

def safe_read_csv(path):
    if os.path.exists(path):
        try:
            return pd.read_csv(path)
        except pd.errors.EmptyDataError:
            return pd.DataFrame(columns=['gene', 'cell'])
    return pd.DataFrame(columns=['gene', 'cell'])

low_points_list = safe_read_csv(low_points_path)
print("low_points_list:", low_points_list.shape)

no_points_list = safe_read_csv(no_points_path)
print("no_points_list:", no_points_list.shape)

filter_list = pd.concat([low_points_list, no_points_list]).drop_duplicates()
print("filter_list:", filter_list.shape)
mask = ~df_list_unique.set_index(['gene','cell']).index.isin(
    filter_list.set_index(['gene', 'cell']).index
)
result = df_list_unique[mask]

print("Result shape after filtering:", result.shape)
print("Number of unique cells:", len(result['cell'].unique()))
print("Number of unique genes:", len(result['gene'].unique()))
result.to_csv(f"../3_filter/{dataset}/load_graph_data.csv", index=False)
raw df_list shape: (4163087, 2)
duplicate df_list shape: (307048, 2)
low_points_list: (163259, 2)
no_points_list: (0, 2)
filter_list: (163259, 2)
Result shape after filtering: (143789, 2)
Number of unique cells: 171
Number of unique genes: 2734
step4: Cell partitioning
import os
import pandas as pd
from tqdm import tqdm
import utils_code.partition as pat
from multiprocessing import Pool, cpu_count


dir = f"../4_partition_same/{dataset}_partition/"

os.makedirs(dir, exist_ok=True)

n_sectors = 30
m_rings = 15
k_neighbor = int((n_sectors * m_rings) / 10)
r = 1
result = pd.read_csv(f"../1_input/label/{dataset}_label.csv")
print("Number of TSGs:", result.shape)

df_registered_group = None
nuclear_boundary_group = None

def init_globals(df_reg, nuclear_boundary_reg):
    global df_registered_group, nuclear_boundary_group
    df_registered_group = df_reg.groupby("cell")
    nuclear_boundary_group = nuclear_boundary_reg.groupby("cell")

def process_row(row):
    target_cell = row["cell"]
    target_gene = row["gene"]
    try:
        df = df_registered_group.get_group(target_cell)
        df_filtered = df[df["gene"] == target_gene]
        if df_filtered.empty:
            return
        nuclear_boundary_df = nuclear_boundary_group.get_group(target_cell)
    except KeyError:
        return

    plot_dir = os.path.join(dir, f"{target_cell}/{target_cell}_{n_sectors}_{m_rings}_k{k_neighbor}")
    csv_path = os.path.join(plot_dir, f"{target_gene}_node.csv")
    if os.path.exists(csv_path):
        return

    os.makedirs(plot_dir, exist_ok=True)
    count_matrix, center_points, point_counts, is_virtual, is_edge = pat.count_points_in_areas_same(df_filtered, n_sectors, m_rings, r)
    nuclear_positions = pat.classify_center_points_with_edge(center_points, nuclear_boundary_df, is_edge)

    edges = pat.build_graph_k_nearest(center_points, k=k_neighbor)
    G = pat.build_graph_with_networkx(center_points, edges, is_virtual)
    pat.save_node_data_to_csv_old(center_points, is_virtual, plot_dir, target_gene, point_counts, k=k_neighbor, nuclear_positions=nuclear_positions)

if __name__ == "__main__":
    import multiprocessing
    with Pool(processes=cpu_count(), initializer=init_globals,
              initargs=(df_registered, nuclear_boundary_df_registered)) as pool:
        list(tqdm(pool.imap_unordered(process_row, [row for _, row in result.iterrows()]), total=result.shape[0], desc="Parallel processing"))
Number of TSGs: (8068, 3)
Parallel processing: 100%|██████████| 8068/8068 [05:22<00:00, 24.99it/s]
step5: Enhancement of TSGs
import os
import pandas as pd
import random
from tqdm import tqdm
from concurrent.futures import ProcessPoolExecutor
import utils_code.augumentation as aug


dataset = "seqfish_fibroblast"
n_sectors = 30
m_rings = 15
k_neighbor = int((n_sectors * m_rings) / 10)
dropout_ratios = [0.1, 0.2, 0.3]
dir = f"../4_partition_same/{dataset}_partition/"
def process_cell_gene(row_dict):
    cell = row_dict['cell']
    gene = row_dict['gene']
    path = f"{dir}/{cell}/{cell}_{n_sectors}_{m_rings}_k{k_neighbor}"
    save_path = f"{dir}/{cell}/{cell}_{n_sectors}_{m_rings}_k{k_neighbor}_aug"

    nodes_file = f'{path}/{gene}_node_matrix.csv'
    adj_file = f'{path}/{gene}_adj_matrix.csv'

    if not os.path.exists(nodes_file) or not os.path.exists(adj_file):
        return f"skip {cell} - {gene}"

    try:
        node_matrix = pd.read_csv(nodes_file)
        adj_matrix = pd.read_csv(adj_file)
        random_angle = random.uniform(0, 360)
        node_matrix_rotated = aug.rotate_nodes(node_matrix.copy(), random_angle)
        real_nodes_count = (node_matrix_rotated['is_virtual'] == 0).sum()

        os.makedirs(save_path, exist_ok=True)

        if real_nodes_count >= 10:
            if real_nodes_count <= 100:
                dropout_ratio = dropout_ratios[0]
            elif real_nodes_count <= 150:
                dropout_ratio = dropout_ratios[1]
            else:
                dropout_ratio = dropout_ratios[2]

            adj_matrix_dropped, node_matrix_dropped = aug.dropout_nodes(
                adj_matrix.copy(), node_matrix_rotated.copy(), dropout_ratio)
            adj_matrix_dropped.to_csv(f"{save_path}/{gene}_adj_matrix.csv", index=False)
            node_matrix_dropped.to_csv(f"{save_path}/{gene}_node_matrix.csv", index=False)
        else:
            adj_matrix.to_csv(f"{save_path}/{gene}_adj_matrix.csv", index=False)
            node_matrix_rotated.to_csv(f"{save_path}/{gene}_node_matrix.csv", index=False)

        return f"finish {cell} - {gene}"
    except Exception as e:
        return f"error {cell} - {gene}:{str(e)}"


df_registered = pd.read_csv(f"../1_input/label/{dataset}_label.csv")

com_gene = ["Col1a1", "Fn1", "Fbln2", "Col6a2", "Bgn", # nuclear or nuclear edge
            "Nid1", "Lox",  "P4hb", "Aebp1", "Emp1",
            "Col5a1", "Sdc4", "Postn", "Col3a1", "Pdia6",
            "Col5a2", "Itgb1", "Calu", "Pdia3", "Cyr61",
            "Ddb1", "Myh9", "Actn1", "Tagln2", "Kpnb1", # cytoplasmic
            "Hnrnpf", "Ppp1ca", "Hnrnpl", "Pcbp1", "Tagln",
            "Fscn1", "Psat1", "Cald1", "Snd1", "Uba1",
            "Hnrnpm", "Cap1", "Ssrp1", "Ugdh", "Caprin1",
            "Cyb5r3", "Sh3pxd2a", "Ddr2", "Net1", "Trak2", # 20 protrusion
            "Kif1c", "Kctd10", "Dynll2", "Arhgap11a", "Gxylt1",
            "H6pd", "Gdf11", "Dync1li2", "Palld", "Ppfia1",
            "Naa50","Ptgfr", "Zeb1", "Arhgap32", "Scd1"]
# df_registered = df_registered[~df_registered['gene'].isin(com_gene)]
print(df_registered.shape)
task_list = df_registered[['cell', 'gene']].drop_duplicates().to_dict(orient='records')


with ProcessPoolExecutor(max_workers=8) as executor:
    results = list(tqdm(executor.map(process_cell_gene, task_list), total=len(task_list), desc="In multi-process processing"))

for r in results:
    print(r)
3_GRASP training
step6: Load all TSGs to prepare for training
import gnn_model.graphloader as gra

dataset = "seqfish_fibroblast"

n_sectors = 30
m_rings = 15
k_neighbor = int((n_sectors * m_rings) / 10)
df = pd.read_csv(f"../1_input/label/{dataset}_label.csv")
print(df.shape)

path = f"../4_partition_same/{dataset}_partition"
original_graphs, augmented_graphs = gra.generate_graph_data_target(dataset, df, path, n_sectors, m_rings, k_neighbor)
print(len(original_graphs))
print(len(augmented_graphs))

gene_labels = [data.gene for data in original_graphs]
cell_labels = [data.cell for data in original_graphs]
(8068, 3)
Processing Graphs generate_graph_data_target: 100%|██████████| 8068/8068 [16:37<00:00,  8.09it/s]
8068
8068
dataset = "seqfish_fibroblast"
graphs_number = len(original_graphs)
cell_numbers = len(df['cell'].unique())
gene_numbers = len(df['gene'].unique())
print(f"cell_numbers:{cell_numbers} - gene_numbers:{gene_numbers} - graphs_number:{graphs_number}")

save_path = f"../5.1_graph_data"
if not os.path.exists(save_path):
    os.makedirs(save_path)

graph_data = {"original_graphs": original_graphs,
              "augmented_graphs": augmented_graphs,
              "gene_labels": gene_labels,
              "cell_labels": cell_labels}

save_file = f"{save_path}/{dataset}_cell{cell_numbers}_gene{gene_numbers}_graph{graphs_number}.pkl"
with open(save_file, 'wb') as f:
    pickle.dump(graph_data, f)

print(f"Graph data saved to {save_file}")
cell_numbers:171 - gene_numbers:59 - graphs_number:8068
Graph data saved to ../5.1_graph_data/seqfish_fibroblast_cell171_gene59_graph8068.pkl
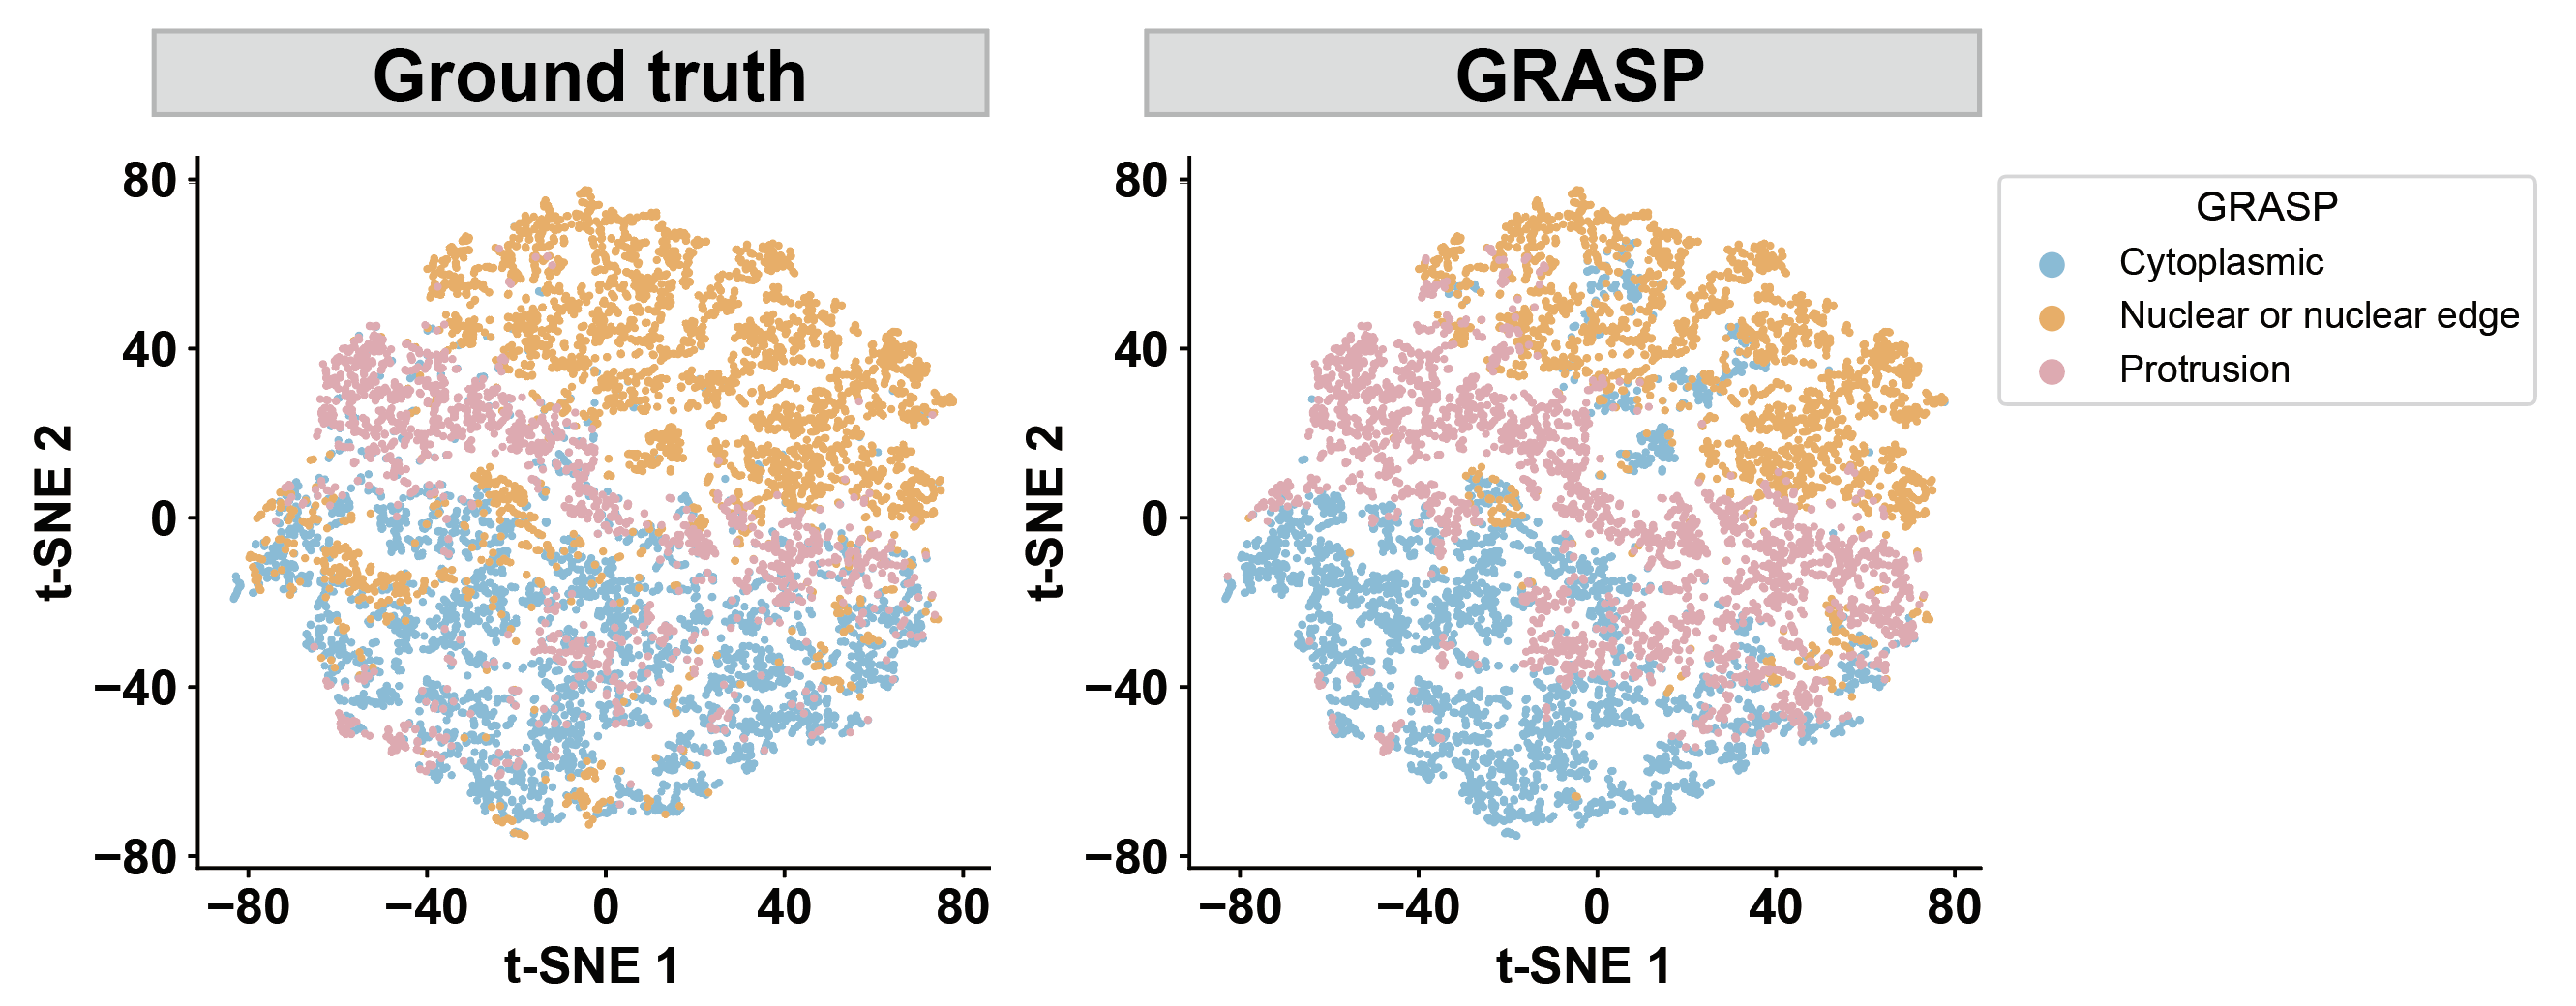
step7: Clustering and identifying spatial localization patterns
dataset = "seqfish_fibroblast"
a, b, lr, epoch = 0.2, 0.8, 0.005, 200
our_label = pd.read_csv(f'../1.5_benchmark/method4_ours/{dataset}/ours_label_a{a}_b{b}.csv')

color_map = {'Nuclear or nuclear edge': '#fbb05b', 'Cytoplasmic': '#7bc4e2','Protrusion': '#EDABB5'}

def plot_tsne(data, label_col, title, legend_title, save_name):
    plt.figure(figsize=(7, 4))
    for label, group in data.groupby(label_col):
        plt.scatter(x=group['tsne_x'], y=group['tsne_y'], color=color_map[label], label=label, s=2)

    ax = plt.gca()
    ax.spines['top'].set_visible(False)
    ax.spines['right'].set_visible(False)
    ax.spines['left'].set_linewidth(1)
    ax.spines['bottom'].set_linewidth(1)
    ax.xaxis.set_major_locator(MultipleLocator(40))
    ax.yaxis.set_major_locator(MultipleLocator(40))
    ax.tick_params(axis='x', which='both', direction='out', length=3, width=1, color='black', top=False, bottom=True, labelsize=16)
    ax.tick_params(axis='y', which='both', direction='out', length=3, width=1, color='black', right=False, left=True, labelsize=16)
    for label in ax.get_xticklabels():
        label.set_fontweight('bold')
    for label in ax.get_yticklabels():
        label.set_fontweight('bold')
    plt.grid(False)
    plt.legend(title=legend_title, frameon=True, fontsize=12, title_fontsize=13, markerscale=5.0, bbox_to_anchor=(1, 1), loc='upper left')
    plt.title(title, fontsize=16)
    plt.xlabel('t-SNE 1', fontsize=16,fontweight='bold')
    plt.ylabel('t-SNE 2', fontsize=16,fontweight='bold')
    plt.tight_layout()
    for ext in ['png', 'pdf', 'svg']:
        plt.savefig(f'../1.5_benchmark/figure/{dataset}/{save_name}.{ext}', bbox_inches='tight', dpi=300)
    plt.show()


plot_tsne(data=our_label, label_col='graph_level_pattern', title='', legend_title='GRASP', save_name='s1_graphlevel_tsne_ours')

plot_tsne(data=our_label, label_col='groundtruth', title='', legend_title='Ground truth', save_name='s1_graphlevel_tsne_gt')
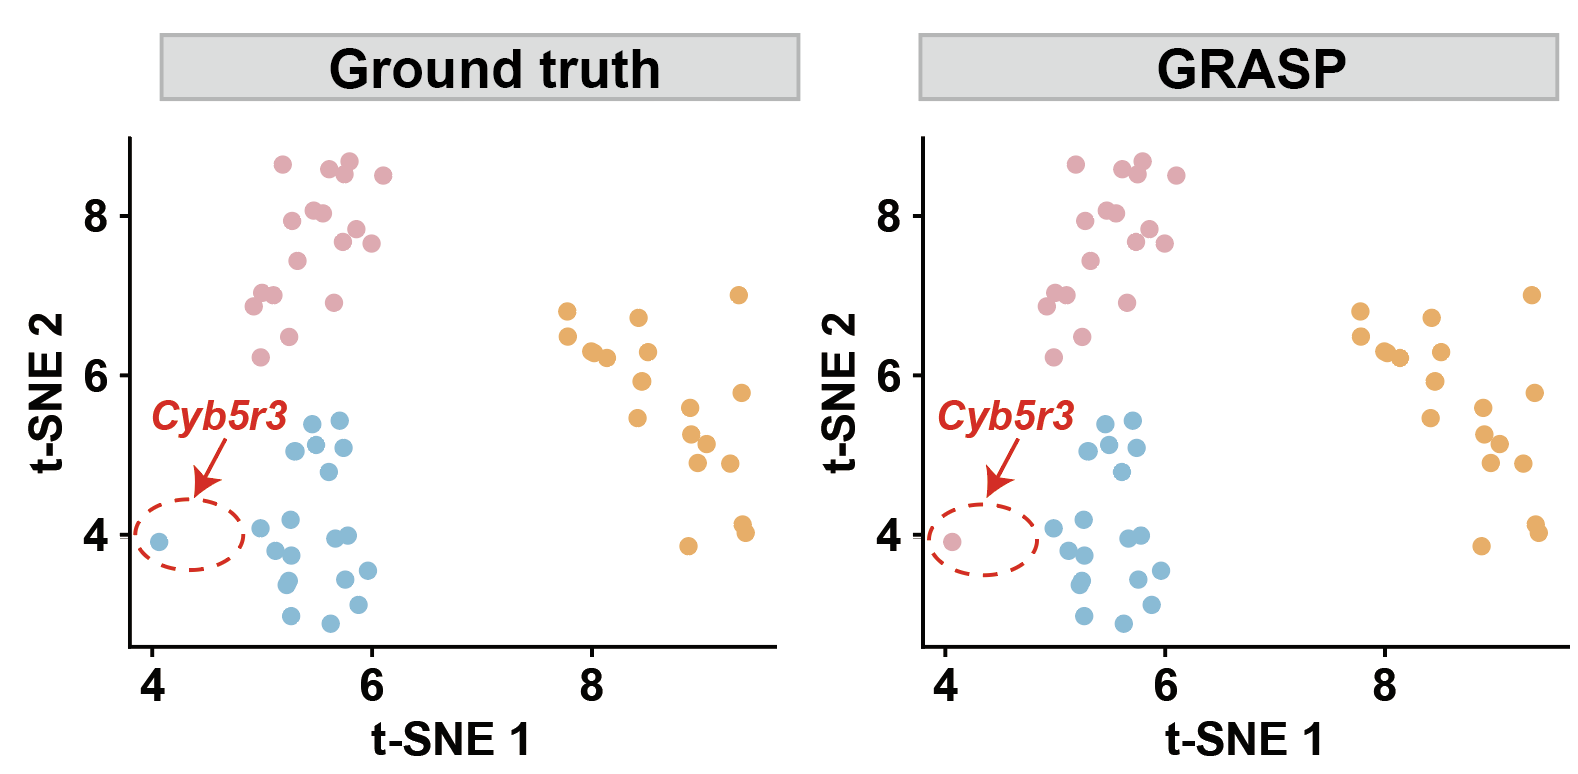
dataset = "seqfish_fibroblast"
our_label = pd.read_csv(f'../1.5_benchmark/method4_ours/{dataset}/ours_label_a{a}_b{b}_genelevel.csv')

color_map = {'Nuclear or nuclear edge': '#fbb05b', 'Cytoplasmic': '#7bc4e2','Protrusion': '#EDABB5'}
def plot_gene_tsne(data, label_col, title, legend_title, save_name):
    plt.figure(figsize=(3.5, 3), dpi=120)
    for label, group in data.groupby(label_col):
        plt.scatter(x=group['tsne_x'], y=group['tsne_y'], color=color_map[label], label=label, s=20)
    ax = plt.gca()
    ax.spines['top'].set_visible(False)
    ax.spines['right'].set_visible(False)
    ax.spines['left'].set_linewidth(1)
    ax.spines['bottom'].set_linewidth(1)
    ax.xaxis.set_major_locator(MultipleLocator(2))
    ax.yaxis.set_major_locator(MultipleLocator(2))
    ax.tick_params(axis='x', which='both', direction='out', length=3, width=1, color='black', top=False, bottom=True, labelsize=14)
    ax.tick_params(axis='y', which='both', direction='out', length=3, width=1, color='black', right=False, left=True, labelsize=14)
    for label in ax.get_xticklabels():
        label.set_fontweight('bold')
    for label in ax.get_yticklabels():
        label.set_fontweight('bold')
    plt.grid(False)
    plt.title(title, fontsize=16)
    plt.xlabel('t-SNE 1', fontsize=14, fontweight='bold')
    plt.ylabel('t-SNE 2', fontsize=14, fontweight='bold')
    plt.tight_layout()
    for ext in ['png', 'pdf', 'svg']:
        plt.savefig(f'../1.5_benchmark/figure/{dataset}/{save_name}.{ext}', bbox_inches='tight', dpi=300)
    plt.show()

plot_gene_tsne(data=our_label, label_col='gene_level_pattern', title='', legend_title='Spatial pattern',save_name='s2_genelevel_tsne_ours')

plot_gene_tsne(data=our_label, label_col='groundtruth', title='', legend_title='Spatial pattern',save_name='s2_genelevel_tsne_gt')
step8: Calculate the GRASP similarity of the embedding
dataset, cell_numbers, gene_numbers, graphs_number =  "seqfish_fibroblast", 171, 59, 8068
a, b, lr, epoch = 0.2, 0.8, 0.005, 200
batch = "seqfish_cosine_nocluster_noclip_js_a02b08_20250704_153934"
save_path = f"../6.1_embedding/{dataset}/graph{graphs_number}/gat_moco3/pos4_temp0.07_a{a}_b{b}_c0.0/n30_m15_cluster3_uniform_scaler/{batch}"
df = pd.read_csv(f"{save_path}/epoch{epoch}_lr{lr}_embedding.csv")
label = pd.read_csv(f"../1_input/label/{dataset}_label.csv")
print(label.shape)
(8068, 3)
list1 = ["Col1a1", "Fn1", "Fbln2", "Col6a2", "Bgn", # nuclear or nuclear edge genes
            "Nid1", "Lox",  "P4hb", "Aebp1", "Emp1",
            "Col5a1", "Sdc4", "Postn", "Col3a1", "Pdia6",
            "Col5a2", "Itgb1", "Calu", "Pdia3", "Cyr61"]

list2 = ["Ddb1", "Myh9", "Actn1", "Tagln2", "Kpnb1", # cytoplasmic
            "Hnrnpf", "Ppp1ca", "Hnrnpl", "Pcbp1", "Tagln",
            "Fscn1", "Psat1", "Cald1", "Snd1", "Uba1",
            "Hnrnpm", "Cap1", "Ssrp1", "Ugdh", "Caprin1"]

list3 = ["Cyb5r3", "Sh3pxd2a", "Ddr2", "Net1", "Trak2", # 20 protrusion
            "Kif1c", "Kctd10", "Dynll2", "Arhgap11a", "Gxylt1",
            "H6pd", "Gdf11", "Dync1li2", "Palld", "Ppfia1",
            "Naa50","Ptgfr", "Zeb1", "Arhgap32", "Scd1"]

def assign_groundtruth(gene):
    if gene in list1:
        return 'Nuclear or nuclear edge'
    elif gene in list2:
        return 'Cytoplasmic'
    elif gene in list3:
        return 'Protrusion'
    else:
        return 'unknown'

df_copy = df.copy(deep=True)  # embedding
label_copy = label.copy(deep=True)  # label groundtruth
feature_cols = [f'feature_{i}' for i in range(1, 129)]  # 实际使用时改为range(1, 129)
df_copy = df_copy.groupby('gene')[feature_cols].mean().reset_index()

df_copy['groundtruth'] = df_copy['gene'].apply(assign_groundtruth)
true_labels = df_copy['groundtruth'].astype(str).values
features = df_copy.drop(columns=['gene', 'groundtruth']).values  # 特征

pattern_groups = df_copy.groupby('groundtruth')
pattern_means = pattern_groups[feature_cols].mean()
similarity_data = []

# ---- 1. Pattern internal similarity ----
for pattern, group in pattern_groups:
    embeddings = group[feature_cols].values
    sim_matrix = cosine_similarity(embeddings)
    triu_indices = np.triu_indices_from(sim_matrix, k=1)
    sims = sim_matrix[triu_indices]
    for s in sims:
        similarity_data.append({
            'pattern_pair': f'{pattern}',
            'similarity': s,
            'type': 'within'
        })

# ---- 2. Similarity between patterns ----
for p1, p2 in combinations(pattern_groups.groups.keys(), 2):
    group1 = pattern_groups.get_group(p1)
    group2 = pattern_groups.get_group(p2)
    sims = cosine_similarity(group1[feature_cols].values, group2[feature_cols].values).flatten()
    for s in sims:
        similarity_data.append({
            'pattern_pair': f'{p1} to {p2}',
            'similarity': s,
            'type': 'between'
        })

sim_df = pd.DataFrame(similarity_data)
sim_df_within = sim_df[sim_df['type'] == 'within']
sim_df_between = sim_df[sim_df['type'] == 'between']
sim_df_clean = pd.concat([sim_df_within, sim_df_between])

short_names = {'Cytoplasmic': 'Cyto', 'Protrusion': 'Pro', 'Nuclear or nuclear edge': 'Nuc or NE'}

unique_patterns = sim_df_clean['pattern_pair'].unique()
label_map = {}
for p in unique_patterns:
    parts = p.split(' to ')
    if len(parts) == 2:
        a, b = parts
        a_short = short_names.get(a.strip(), a.strip())
        b_short = short_names.get(b.strip(), b.strip())
        label_map[p] = f"{a_short} → {b_short}"
    else:
        label_map[p] = short_names.get(p.strip(), p.strip())

sim_df_clean['pattern_pair'] = sim_df_clean['pattern_pair'].replace(label_map)
my_palette = {'within': '#EDABB5', 'between': '#7bc4e2'}# 'pastel'
fig, ax = plt.subplots(figsize=(4, 4))
sim_df = sim_df_clean
def sort_by_median(data, y_col='similarity', x_col='pattern_pair'):
medians = data.groupby(x_col)[y_col].median().sort_values(ascending=False)
return medians.index.tolist()
sorted_pairs = sort_by_median(sim_df)
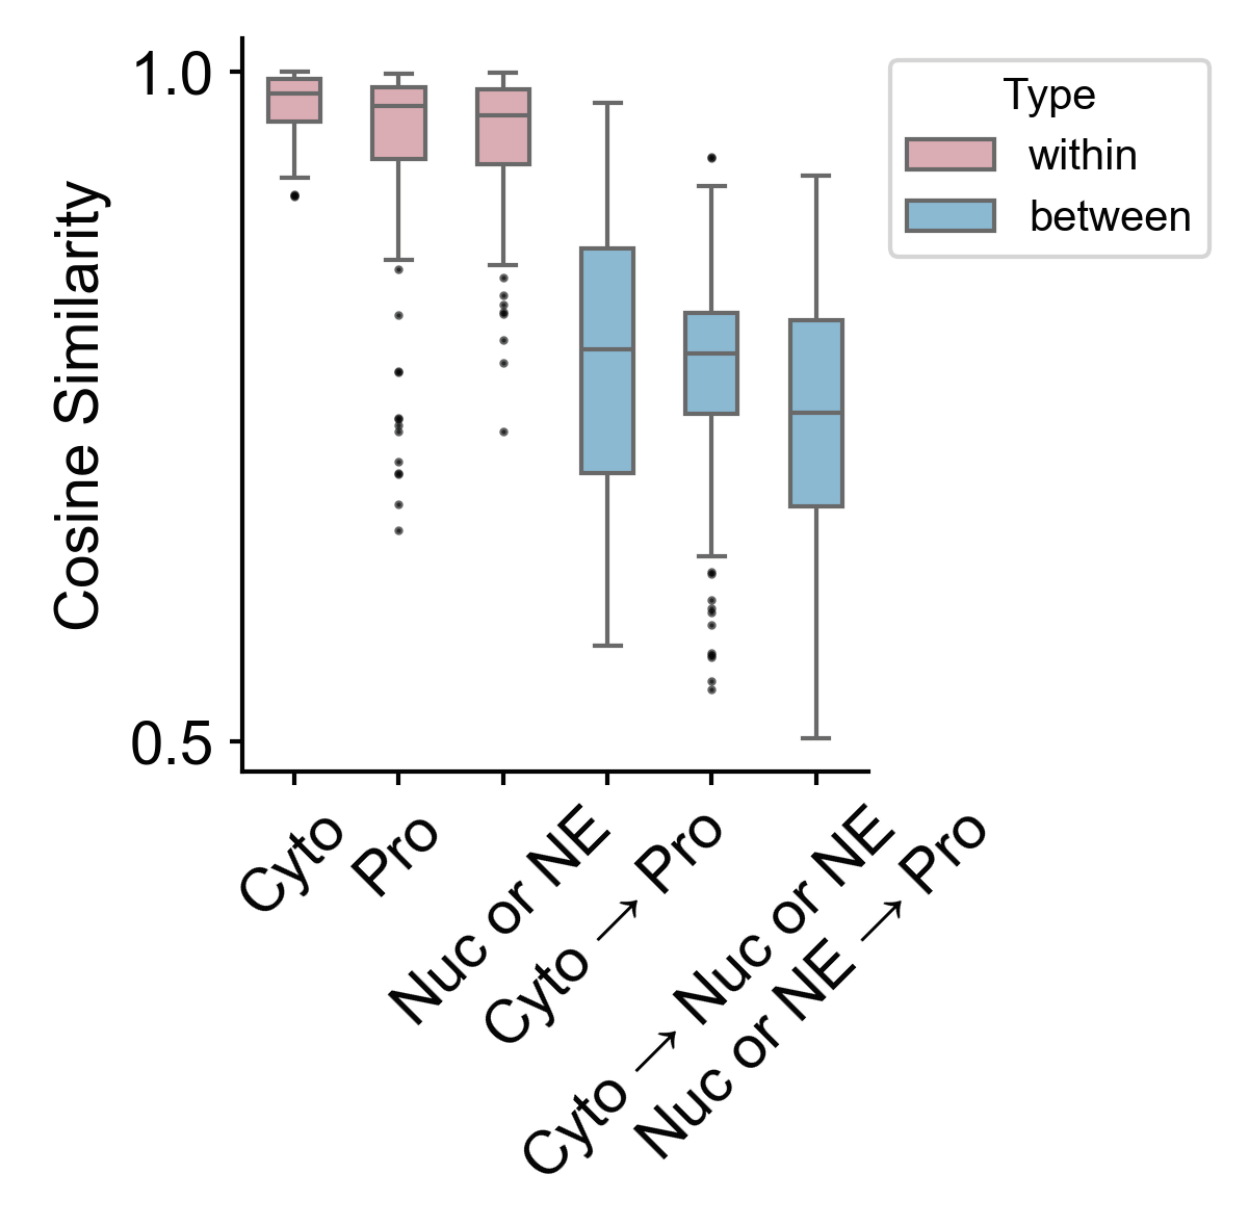
sns.boxplot(data=sim_df, x='pattern_pair', y='similarity', hue='type', palette=my_palette,
width=0.5, order=sorted_pairs, ax=ax, showcaps=True, showbox=True, showfliers=True, linewidth=1,
saturation=0.9,flierprops = dict(marker='o', markersize=1, markerfacecolor='black', markeredgecolor='black', alpha=0.6)
)
ax.set_ylabel("Cosine Similarity", fontsize=14)
ax.set_xlabel("", fontsize=12)
ax.spines['bottom'].set_color('black')
ax.spines['left'].set_color('black')
ax.spines['right'].set_color('none')
ax.spines['top'].set_color('none')
ax.spines['bottom'].set_linewidth(1)
ax.spines['left'].set_linewidth(1)
ax.xaxis.set_major_locator(MultipleLocator(1))
ax.yaxis.set_major_locator(MultipleLocator(0.5))
ax.tick_params(axis='y', which='both', direction='out', length=3, width=1, color='black', right=False, left=True, labelsize=14)
ax.tick_params(axis='x', which='both', direction='out', length=3, width=1, color='black', top=False, bottom=True, rotation=45, labelsize=14)
ax.grid(False)
sns.despine(ax=ax, top=True, right=True)
plt.legend(title='Type', bbox_to_anchor=(1, 1), loc='upper left')
plt.tight_layout()
plt.savefig(f'../1.5_benchmark/figure/{dataset}/{dataset}_embedding1.png', dpi=300, bbox_inches='tight')
plt.savefig(f'../1.5_benchmark/figure/{dataset}/{dataset}_embedding1.pdf', bbox_inches='tight')
plt.savefig(f'../1.5_benchmark/figure/{dataset}/{dataset}_embedding1.svg', bbox_inches='tight')
plt.show()
stats = []
for pair in sorted_pairs:
pair_data = sim_df[sim_df['pattern_pair'] == pair]['similarity']
q1 = np.percentile(pair_data, 25)
q2 = np.percentile(pair_data, 50)
q3 = np.percentile(pair_data, 75)
iqr = q3 - q1
lower_bound = q1 - 1.5 * iqr
upper_bound = q3 + 1.5 * iqr
outliers = pair_data[(pair_data < lower_bound) | (pair_data > upper_bound)]
stats.append({
'Pattern Pair': pair,
'Count': len(pair_data),
'Median': q2,
'Q1': q1,
'Q3': q3,
'IQR': iqr,
'Lower Bound': lower_bound,
'Upper Bound': upper_bound
})
stats_df = pd.DataFrame(stats)
stats_df.to_csv(f'../1.5_benchmark/figure/{dataset}/{dataset}_pattern_pair_stats.csv', index=False)
def get_significance_symbol(p):
if p <= 0.0001:
return '****'
elif p <= 0.001:
return '***'
elif p <= 0.01:
return '**'
elif p <= 0.05:
return '*'
else:
return 'n.s.'
custom_colors = {'Cyto': '#7bc4e2', 'Pro': '#fbb05b', 'Nuc or NE': '#ed6ca4',
'Cyto → Nuc or NE': '#f98fac', 'Cyto → Pro': '#d6b3e4','Nuc or NE → Pro': '#aad8d3'}
short_names = {'Cytoplasmic': 'Cyto', 'Protrusion': 'Pro','Radial': 'Rad', 'Nuclear edge': 'NE', 'Cell edge': 'CE', 'Nuclear': 'Nuc', 'Foci': 'Foci', 'Random': 'Rnd'}
unique_patterns = sim_df_clean['pattern_pair'].unique()
label_map = {}
for p in unique_patterns:
parts = p.split(' to ')
if len(parts) == 2:
a, b = parts
a_short = short_names.get(a.strip(), a.strip())
b_short = short_names.get(b.strip(), b.strip())
label_map[p] = f"{a_short}→{b_short}"
else:
label_map[p] = short_names.get(p.strip(), p.strip())
sim_df_clean['pattern_pair'] = sim_df_clean['pattern_pair'].replace(label_map)
fig, axes = plt.subplots(1, 3, figsize=(8, 4))
sim_df1 = sim_df[sim_df['pattern_pair'].str.contains('Cyto')]
sim_df2 = sim_df[sim_df['pattern_pair'].str.contains('Pro')]
sim_df3 = sim_df[sim_df['pattern_pair'].str.contains('Nuc or NE')]
patterns = [sim_df1, sim_df2, sim_df3]
titles = ["Cytoplasmic", "Protrusion", "Nuclear or nuclear edge"]
reference_keywords = ['Cyto', 'Pro', 'Nuc or NE']
p_values = []
for i, (df_sub, ax, title) in enumerate(zip(patterns, axes, titles)):
ref_keyword = reference_keywords[i]
ref_group = [g for g in df_sub['pattern_pair'].unique() if ref_keyword in g]
if not ref_group:
continue
ref_group = ref_group[0]
other_groups = [g for g in df_sub['pattern_pair'].unique() if g != ref_group]
medians = df_sub[df_sub['pattern_pair'].isin(other_groups)].groupby('pattern_pair')['similarity'].median()
sorted_other = medians.sort_values(ascending=False).index.tolist()
sorted_groups = [ref_group] + sorted_other
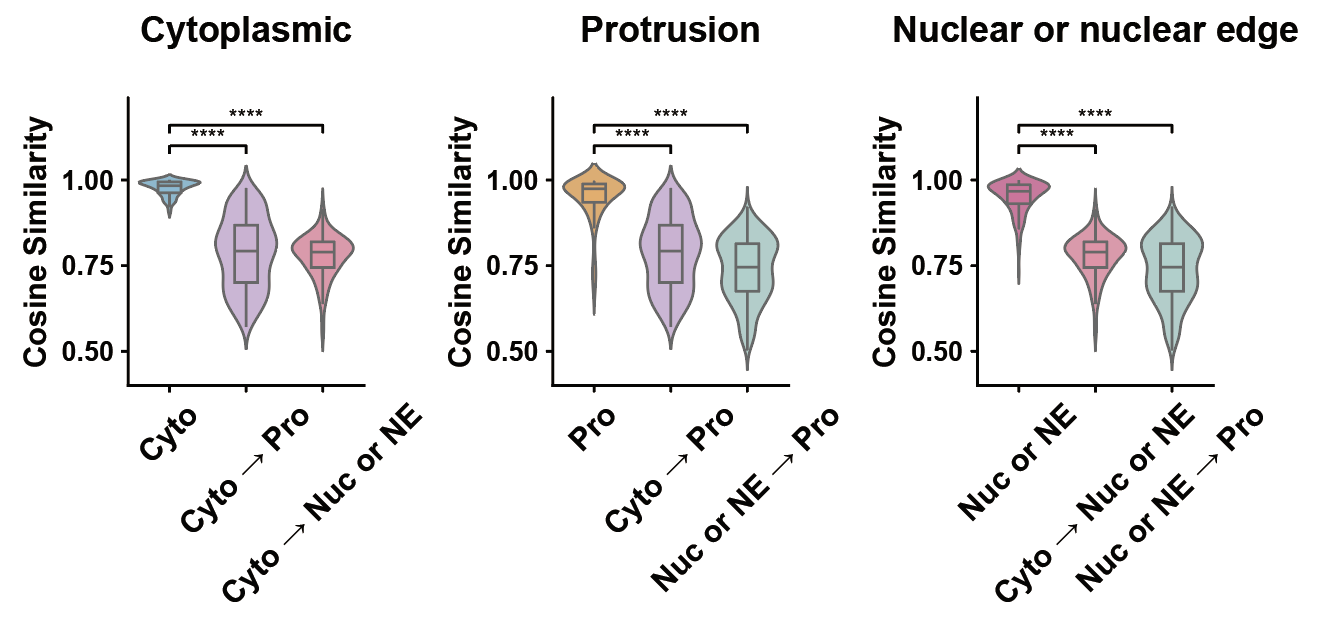
sns.violinplot(data=df_sub, x='pattern_pair', y='similarity', palette=custom_colors, saturation=0.8, order=sorted_groups,
width=0.8, ax=ax, linewidth=1, inner=None)
sns.boxplot(data=df_sub, x='pattern_pair', y='similarity', palette=custom_colors, order=sorted_groups,
width=0.3, ax=ax, showcaps=False, showbox=True, showfliers=False, linewidth=1,
saturation=0.9, legend=False)
ax.set_title(title, fontsize=16, weight='bold', pad=25)
ax.set_ylabel("Cosine Similarity", fontsize=14,fontweight='bold')
ax.set_xlabel("", fontsize=12)
ax.spines['bottom'].set_color('black')
ax.spines['left'].set_color('black')
ax.spines['right'].set_color('none')
ax.spines['top'].set_color('none')
ax.spines['bottom'].set_linewidth(1)
ax.spines['left'].set_linewidth(1)
ax.xaxis.set_major_locator(MultipleLocator(1))
ax.yaxis.set_major_locator(MultipleLocator(0.25))
ax.tick_params(axis='x', which='both', direction='out', length=3, width=1, color='black', top=False, bottom=True, rotation=45, labelsize=14)
ax.tick_params(axis='y', which='both', direction='out', length=3, width=1, color='black', right=False, left=True, labelsize=12)
for label in ax.get_xticklabels():
label.set_fontweight('bold')
for label in ax.get_yticklabels():
label.set_fontweight('bold')
sns.despine(ax=ax, top=True, right=True)
ax.grid(False)
ax.set_ylim(0.4, 1.24)
sns.despine(ax=ax)
groups = sorted_groups
group_map = {g: df_sub[df_sub['pattern_pair'] == g]['similarity'] for g in groups}
y_max = df_sub['similarity'].max()
y_range = 0.5
ref_values = group_map[ref_group]
for j, g in enumerate(groups):
if g == ref_group:
continue
values = group_map[g]
stat, p = mannwhitneyu(ref_values, values, alternative='two-sided')
x1 = groups.index(ref_group)
x2 = groups.index(g)
step = 0.06 * (j + 1)
line_y = 0.96 + step
text_y = line_y + 0.008
ax.plot([x1, x1, x2, x2], [line_y, line_y + 0.02, line_y+0.02, line_y], lw=1, c='black')
ax.text((x1 + x2) / 2, text_y+0.001, get_significance_symbol(p), ha='center', va='bottom', fontsize=10)
p_values.append({
'Pattern Pair': f"{ref_group} vs {g}",
'p-value': p,
'Significance': get_significance_symbol(p)
})
plt.tight_layout()
plt.subplots_adjust(wspace=0.8, hspace=0.6)
plt.savefig(f'../1.5_benchmark/figure/{dataset}/{dataset}_emebdding2.png', dpi=300, bbox_inches='tight')
plt.savefig(f'../1.5_benchmark/figure/{dataset}/{dataset}_emebdding2.pdf', bbox_inches='tight')
plt.savefig(f'../1.5_benchmark/figure/{dataset}/{dataset}_emebdding2.svg', bbox_inches='tight')
plt.show()
p_values_df = pd.DataFrame(p_values)
p_values_df.to_csv(f'../1.5_benchmark/figure/{dataset}/{dataset}_p_values3.csv', index=False)
p_values_df
| Pattern Pair | p-value | Significance | |
|---|---|---|---|
| 0 | Cyto vs Cyto → Pro | 3.343267e-78 | **** |
| 1 | Cyto vs Cyto → Nuc or NE | 8.777574e-86 | **** |
| 2 | Pro vs Cyto → Pro | 3.641106e-54 | **** |
| 3 | Pro vs Nuc or NE → Pro | 1.352650e-66 | **** |
| 4 | Nuc or NE vs Cyto → Nuc or NE | 7.410871e-80 | **** |
| 5 | Nuc or NE vs Nuc or NE → Pro | 1.768558e-79 | **** |
my_palette = {'within': '#EDABB5', 'between': '#7bc4e2'}# 'pastel'
p_values = []
fig, ax = plt.subplots(figsize=(2.5, 3))
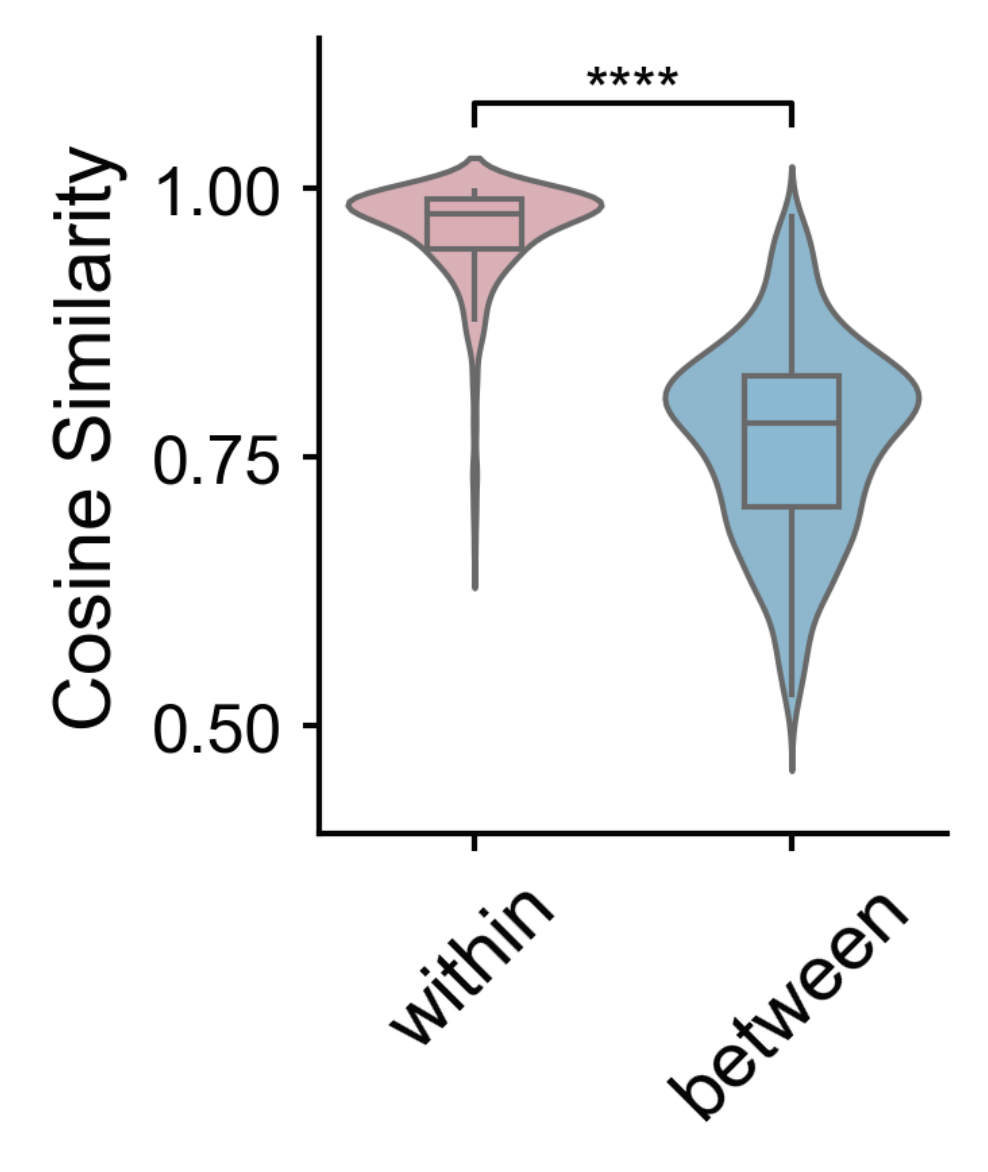
sns.violinplot(data=sim_df, x='type', y='similarity', hue='type', palette=my_palette, saturation=0.8,width=0.8, ax=ax, linewidth=1, inner=None)
sns.boxplot(data=sim_df, x='type', y='similarity', hue='type', palette=my_palette,
width=0.3, ax=ax, showcaps=False, showbox=True, showfliers=False, linewidth=1,
saturation=0.9, legend=False)
# ax.set_title("Gene Embedding Similarity", weight='bold',fontsize=16, pad=20)
ax.set_ylabel("Cosine Similarity", fontsize=14)
ax.set_xlabel("", fontsize=12)
# ax.tick_params(axis='x')
ax.spines['bottom'].set_color('black')
ax.spines['left'].set_color('black')
ax.spines['right'].set_color('none')
ax.spines['top'].set_color('none')
ax.spines['bottom'].set_linewidth(1)
ax.spines['left'].set_linewidth(1)
ax.xaxis.set_major_locator(MultipleLocator(1))
ax.yaxis.set_major_locator(MultipleLocator(0.25))
ax.tick_params(axis='x', which='both', direction='out', length=3, width=1, color='black', top=False, bottom=True, rotation=45, labelsize=14)
ax.tick_params(axis='y', which='both', direction='out', length=3, width=1, color='black', right=False, left=True, labelsize=12)
sns.despine(ax=ax, top=True, right=True)
ax.grid(False)
ax.set_ylim(0.4, 1.14)
within = sim_df[sim_df['type'] == 'within']['similarity']
between = sim_df[sim_df['type'] == 'between']['similarity']
stat, p = mannwhitneyu(within, between, alternative='two-sided')
if p <= 0.0001:
symbol = '****'
elif p <= 0.001:
symbol = '***'
elif p <= 0.01:
symbol = '**'
elif p <= 0.05:
symbol = '*'
else:
symbol = 'n.s.'
y_max = sim_df['similarity'].max()
y_min = sim_df['similarity'].min()
y_range = y_max - y_min - 0.1
line_y = y_max + 0.15 * y_range
text_y = line_y + 0.01 * y_range
x1, x2 = 0, 1
ax.plot([x1, x1, x2, x2], [line_y, line_y + 0.02, line_y + 0.02, line_y], lw=1, c='black')
ax.text((x1 + x2) / 2, text_y, symbol, ha='center', va='bottom', fontsize=11)
plt.tight_layout()
p_values.append({'Pattern Pair': 'within vs between','p-value': p,'Significance': get_significance_symbol(p)})
p_values_df = pd.DataFrame(p_values)
print(p_values_df)
p_values_df.to_csv(f'../1.5_benchmark/figure/{dataset}/{dataset}_p_values4.csv', index=False)
plt.savefig(f'../1.5_benchmark/figure/{dataset}/{dataset}_emebdding3.png', dpi=300, bbox_inches='tight')
plt.savefig(f'../1.5_benchmark/figure/{dataset}/{dataset}_emebdding3.pdf', bbox_inches='tight')
plt.savefig(f'../1.5_benchmark/figure/{dataset}/{dataset}_emebdding3.svg', bbox_inches='tight')
plt.show()
        Pattern Pair        p-value Significance
0  within vs between  3.300398e-214         ****
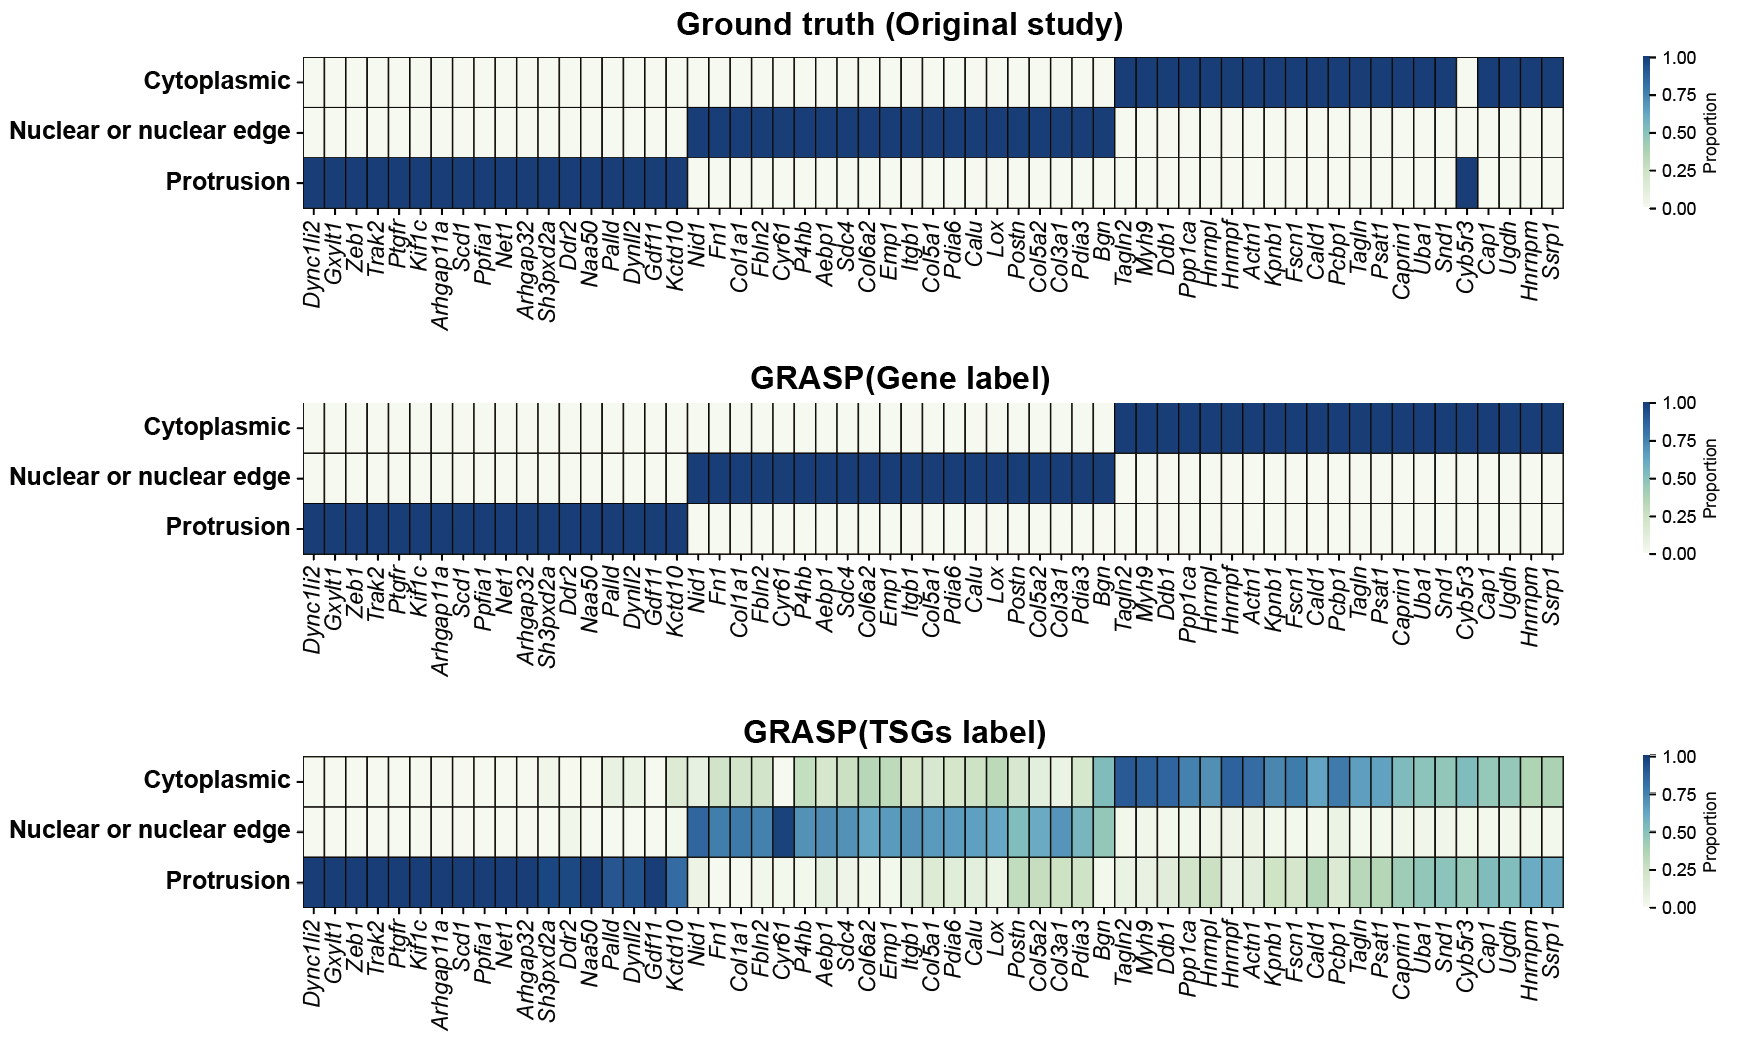
step9: Plot a TSG clustering heatmap
a, b = 0.2, 0.8
dataset = "seqfish_fibroblast"
df = pd.read_csv(f"../1.5_benchmark/method4_ours/{dataset}/ours_label_a{a}_b{b}.csv")
gene_counts = df.groupby('groundtruth')['gene'].nunique().reset_index()
gene_counts.columns = ['groundtruth', 'unique_genes']

df['cell_gene'] = df['cell'] + '_' + df['gene']
cell_gene_counts = df.groupby('groundtruth')['cell_gene'].nunique().reset_index()
cell_gene_counts.columns = ['groundtruth', 'unique_cell_genes']
stats_df = pd.merge(gene_counts, cell_gene_counts, on='groundtruth')
print(stats_df)
               groundtruth  unique_genes  unique_cell_genes
0              Cytoplasmic            20               3322
1  Nuclear or nuclear edge            20               3233
2               Protrusion            19               1513
import pandas as pd
import matplotlib.pyplot as plt
import seaborn as sns
from matplotlib.colors import LinearSegmentedColormap

a, b = 0.2, 0.8
dataset = "seqfish_fibroblast"

selected_genes = [
    'Dync1li2', 'Gxylt1', 'Zeb1', 'Trak2', 'Ptgfr', 'Kif1c', 'Arhgap11a', 'Scd1', 'Ppfia1', 'Net1',
    'Arhgap32', 'Sh3pxd2a', 'Ddr2', 'Naa50', 'Palld', 'Dynll2', 'Gdf11', 'Kctd10', 'Nid1', 'Fn1',
    'Col1a1', 'Fbln2', 'Cyr61', 'P4hb', 'Aebp1', 'Sdc4', 'Col6a2', 'Emp1', 'Itgb1', 'Col5a1',
    'Pdia6', 'Calu', 'Lox', 'Postn', 'Col5a2', 'Col3a1', 'Pdia3', 'Bgn', 'Tagln2', 'Myh9', 'Ddb1',
    'Ppp1ca', 'Hnrnpl', 'Hnrnpf', 'Actn1', 'Kpnb1', 'Fscn1', 'Cald1', 'Pcbp1', 'Tagln', 'Psat1',
    'Caprin1', 'Uba1', 'Snd1', 'Cyb5r3', 'Cap1', 'Ugdh', 'Hnrnpm', 'Ssrp1'
]

custom_colors = ['white', '#c6c0e0', '#a3a3c2']
custom_cmap = LinearSegmentedColormap.from_list('custom_blues', custom_colors)

# Create 3 subplots vertically
fig, axes = plt.subplots(nrows=3, figsize=(15, 8), constrained_layout=True)

# 1. Plot: groundtruth
df1 = pd.read_csv(f"../1.5_benchmark/method4_ours/{dataset}/ours_label_a{a}_b{b}_genelevel.csv")
label_counts = df1.groupby(['gene', 'groundtruth']).size().unstack(fill_value=0)
label_props = label_counts.div(label_counts.sum(axis=1), axis=0)
label_props_selected = label_props.loc[label_props.index.intersection(selected_genes)]
label_props_selected = label_props_selected.reindex(selected_genes)
sns.heatmap(label_props_selected.T, annot=False, cmap="GnBu", ax=axes[0], cbar_kws={'label': 'Proportion'},
            linewidths=0.5, linecolor='black')
axes[0].set_title("Groundtruth", fontsize=14)
axes[0].tick_params(axis='x', labelsize=10)
axes[0].tick_params(axis='y', labelsize=12)
for label in axes[0].get_yticklabels(): label.set_fontweight('bold')

# 2. Plot: gene_level_pattern
df2 = pd.read_csv(f"../1.5_benchmark/method4_ours/{dataset}/ours_label_a{a}_b{b}_genelevel.csv")
label_counts = df2.groupby(['gene', 'gene_level_pattern']).size().unstack(fill_value=0)
label_props = label_counts.div(label_counts.sum(axis=1), axis=0)
label_props_selected = label_props.loc[label_props.index.intersection(selected_genes)]
label_props_selected = label_props_selected.reindex(selected_genes)
sns.heatmap(label_props_selected.T, annot=False, cmap="GnBu", ax=axes[1], cbar_kws={'label': 'Proportion'},
            linewidths=0.5, linecolor='black')
axes[1].set_title("Gene-level Prediction", fontsize=14)
axes[1].tick_params(axis='x', labelsize=10)
axes[1].tick_params(axis='y', labelsize=12)
for label in axes[1].get_yticklabels(): label.set_fontweight('bold')

# 3. Plot: graph_level_pattern
df3 = pd.read_csv(f"../1.5_benchmark/method4_ours/{dataset}/ours_label_a{a}_b{b}.csv")
label_counts = df3.groupby(['gene', 'graph_level_pattern']).size().unstack(fill_value=0)
label_props = label_counts.div(label_counts.sum(axis=1), axis=0)
label_props_selected = label_props.loc[label_props.index.intersection(selected_genes)]
label_props_selected = label_props_selected.reindex(selected_genes)
sns.heatmap(label_props_selected.T, annot=False, cmap="GnBu", ax=axes[2], cbar_kws={'label': 'Proportion'},
            linewidths=0.5, linecolor='black')
axes[2].set_title("Graph-level Prediction", fontsize=14)
axes[2].tick_params(axis='x', labelsize=10)
axes[2].tick_params(axis='y', labelsize=12)
for label in axes[2].get_yticklabels(): label.set_fontweight('bold')

plt.show()