05_MERFISH_intestine
1_dataset details
| Dataset | Cell number | Gene number | Graph | Pattern |
|---|---|---|---|---|
| merfish_intestine | 706 | 56 | 4499 | 7 |
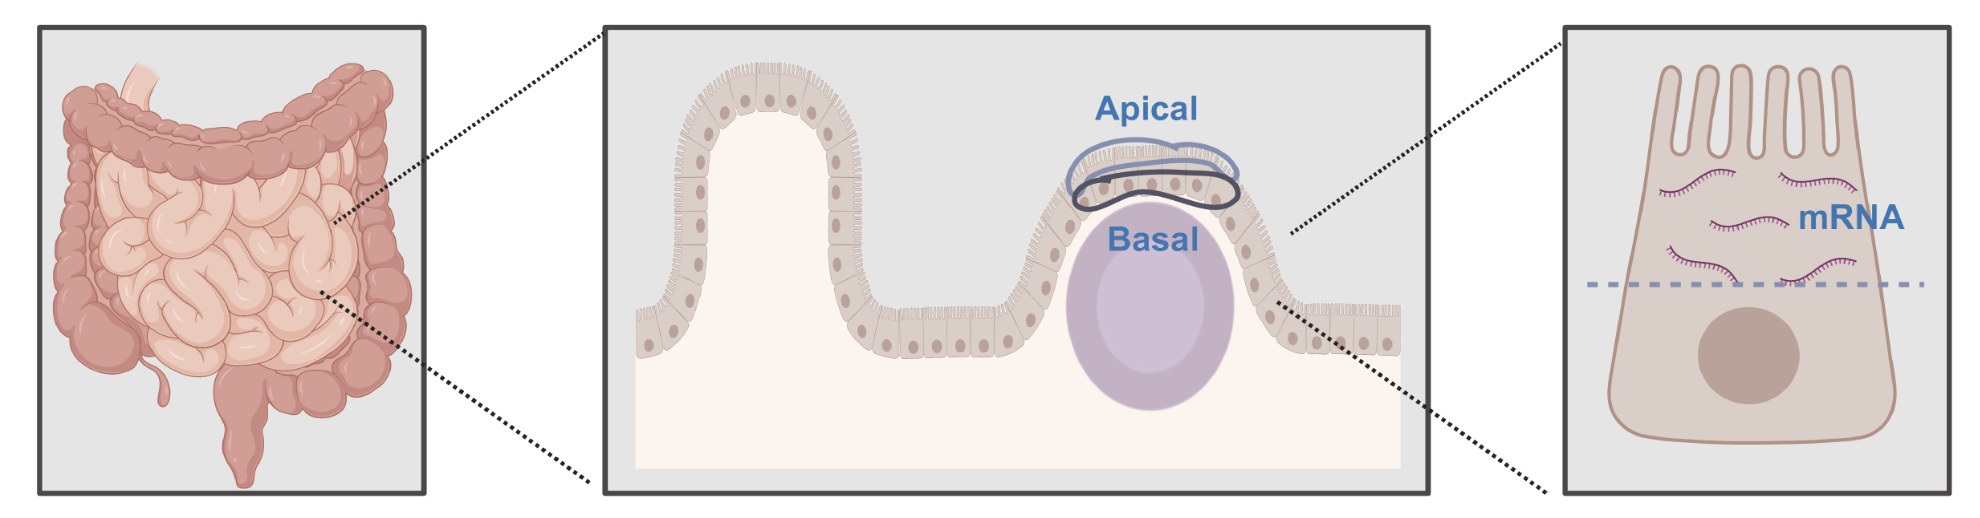
How do you divide cells and assign transcripts?
2_GRASP preprocessing
step1: Load data
dataset = "merfish_intestine_Enterocyte_resegment"
outfile = f'../1_input/pkl_data/{dataset}_data_dict.pkl'

with open(outfile, 'rb') as f:
    pickle_dict = pickle.load(f)


df_registered = pickle_dict['df_registered']
cell_radii = pickle_dict['cell_radii']
cell_boundary = pickle_dict['cell_boundary']
nuclear_boundary = pickle_dict['nuclear_boundary']
nuclear_boundary_df_registered = pickle_dict['nuclear_boundary_df_registered']
type_list = pickle_dict['type_list']
cell_list_dict = pickle_dict['cell_list_dict']
cell_list_all = pickle_dict['cell_list_all']
cell_mask_df = pickle_dict['cell_mask_df']
df = pickle_dict['data_df']
gene_list_dict = pickle_dict['genes']
print(len(df_registered['cell'].unique()))
print(len(df_registered['gene'].unique()))
706
237
type = df_registered[['cell','type']]
type = type.drop_duplicates()
unique_types = df_registered['type'].unique()
print("All unique cell types:")
print(unique_types)
print(f"\nThere are a total of {len(unique_types)} different cell types.")
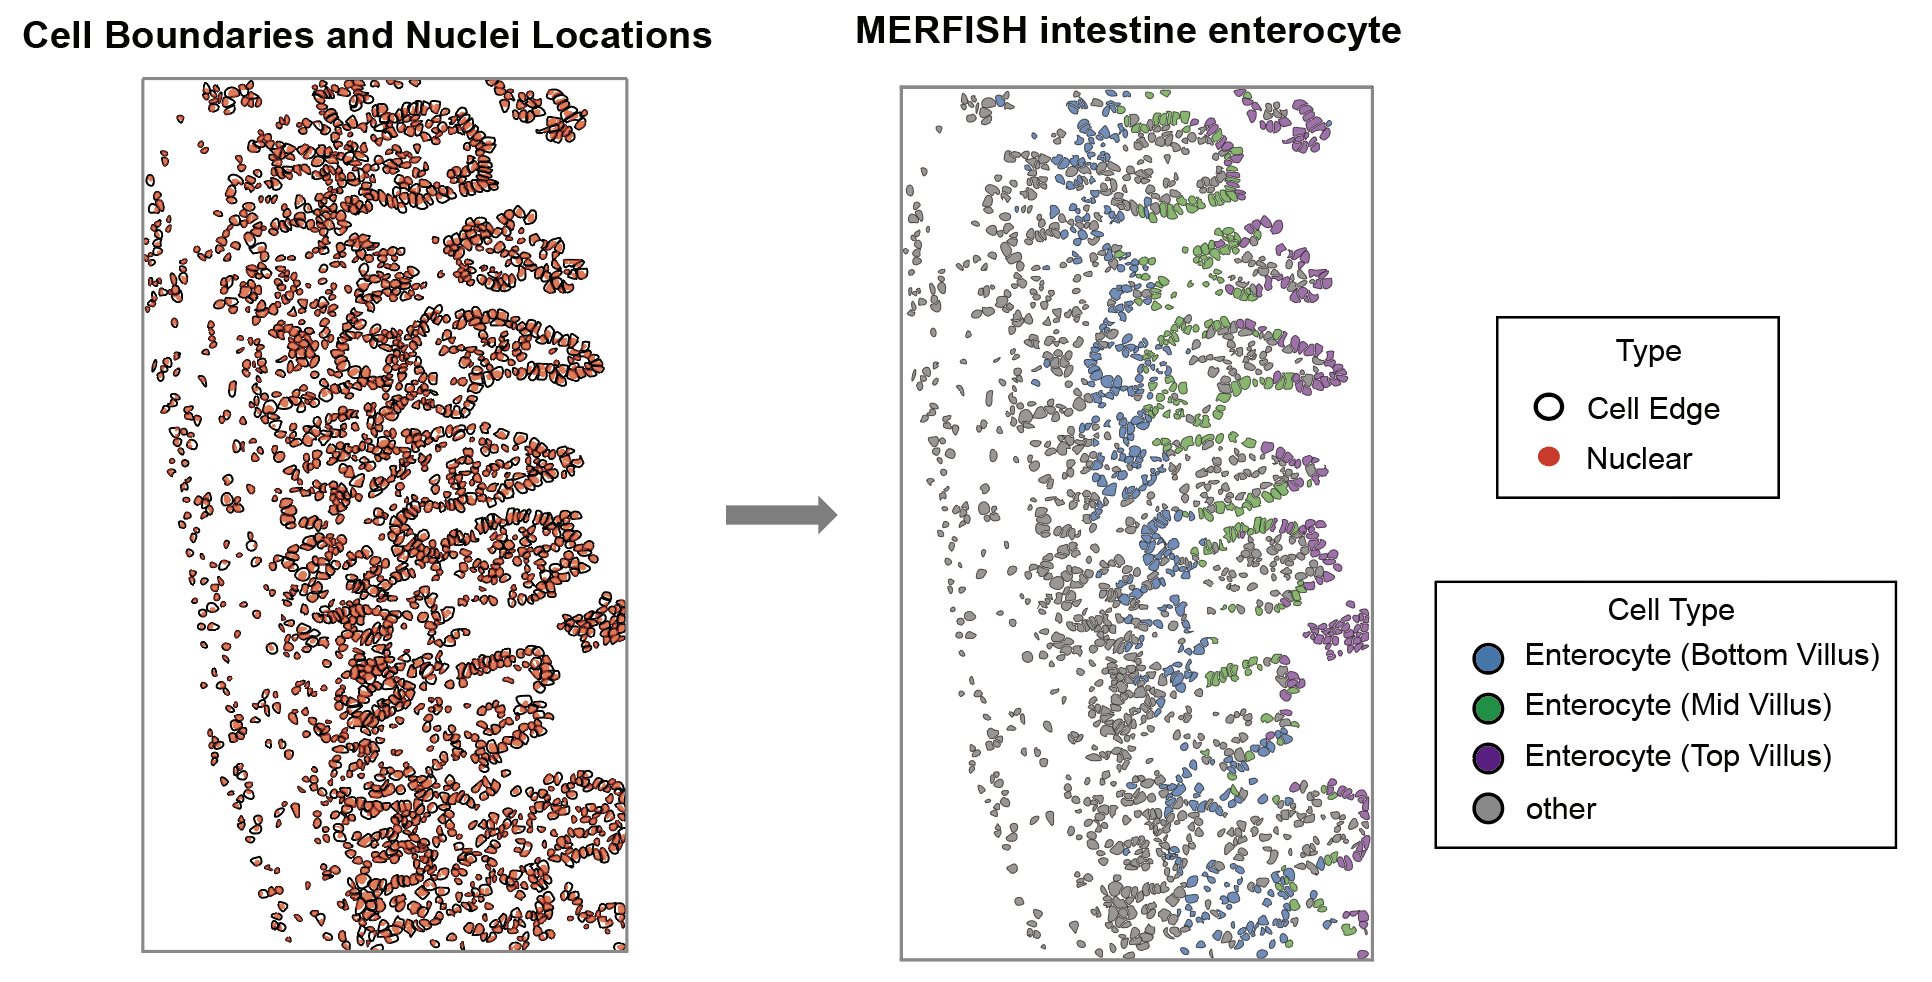
All unique cell types:
['Enterocyte (Bottom Villus)' 'Enterocyte (Mid Villus)'
 'Enterocyte (Top Villus)']

There are a total of 3 different cell types.
step2: Cell partitioning
import os
import pandas as pd
from tqdm import tqdm
import utils_code.partition as pat
from multiprocessing import Pool, cpu_count


dataset = "merfish_intestine_Enterocyte_resegment_new"
dir = f"../4_partition_same/{dataset}_partition/"
os.makedirs(dir, exist_ok=True)

n_sectors = 30
m_rings = 15
k_neighbor = int((n_sectors * m_rings) / 10)
r = 1

result = pd.read_csv(f"../3_filter/{dataset}/load_graph_data.csv")
print("Number of TSGs:", result.shape)

df_registered_group = None
nuclear_boundary_group = None

def init_globals(df_reg, nuclear_boundary_reg):
    global df_registered_group, nuclear_boundary_group
    df_registered_group = df_reg.groupby("cell")
    nuclear_boundary_group = nuclear_boundary_reg.groupby("cell")

def process_row(row):
    target_cell = row["cell"]
    target_gene = row["gene"]
    try:
        df = df_registered_group.get_group(target_cell)
        df_filtered = df[df["gene"] == target_gene]
        if df_filtered.empty:
            return
        nuclear_boundary_df = nuclear_boundary_group.get_group(target_cell)
    except KeyError:
        return

    plot_dir = os.path.join(dir, f"{target_cell}/{target_cell}_{n_sectors}_{m_rings}_k{k_neighbor}")
    csv_path = os.path.join(plot_dir, f"{target_gene}_node.csv")
    if os.path.exists(csv_path):
        return

    os.makedirs(plot_dir, exist_ok=True)
    count_matrix, center_points, point_counts, is_virtual, is_edge = pat.count_points_in_areas_same(df_filtered, n_sectors, m_rings, r)
    nuclear_positions = pat.classify_center_points_with_edge(center_points, nuclear_boundary_df, is_edge)
    edges = pat.build_graph_k_nearest(center_points, k=k_neighbor)
    G = pat.build_graph_with_networkx(center_points, edges, is_virtual)
    pat.save_node_data_to_csv_old(center_points, is_virtual, plot_dir, target_gene, point_counts, k=k_neighbor, nuclear_positions=nuclear_positions)

if __name__ == "__main__":
    import multiprocessing
    with Pool(processes=cpu_count(), initializer=init_globals,
              initargs=(df_registered, nuclear_boundary_df_registered)) as pool:
        list(tqdm(pool.imap_unordered(process_row, [row for _, row in result.iterrows()]), total=result.shape[0], desc="In parallel processing"))
Number of TSGs: (4331, 2)
In parallel processing: 100%|██████████| 4331/4331 [01:33<00:00, 46.34it/s]
step3: Enhancement of TSGs
import utils_code.augumentation as aug
import random
dataset = "merfish_intestine_Enterocyte_resegment_new"
n_sectors = 30
m_rings = 15
k_neighbor = int((n_sectors * m_rings) / 10)
dropout_ratios = [0.1, 0.2, 0.3]
cell_list = df_registered['cell'].unique()
gene_list = df_registered['gene'].unique()

dir = f"../4_partition_same/{dataset}_partition/"

for cell in tqdm(cell_list, desc="Processing all cells", leave=True):
    path = f"{dir}/{cell}/{cell}_{n_sectors}_{m_rings}_k{k_neighbor}"
    save_path = f"{dir}/{cell}/{cell}_{n_sectors}_{m_rings}_k{k_neighbor}_aug"
    if not os.path.exists(save_path):
        os.makedirs(save_path)
    for gene in gene_list:
        nodes_file = f'{path}/{gene}_node_matrix.csv'
        adj_file = f'{path}/{gene}_adj_matrix.csv'
        if not os.path.exists(nodes_file) or not os.path.exists(adj_file):
            continue
        node_matrix = pd.read_csv(nodes_file)
        adj_matrix = pd.read_csv(adj_file)
        random_angle = random.uniform(0, 360)
        node_matrix_rotated = aug.rotate_nodes(node_matrix.copy(), random_angle)
        real_nodes_count = (node_matrix_rotated['is_virtual'] == 0).sum()
        if real_nodes_count >= 10:
            if real_nodes_count <= 100:
                dropout_ratio = dropout_ratios[0]
            elif real_nodes_count > 100 and real_nodes_count <= 150:
                dropout_ratio = dropout_ratios[1]
            else:
                dropout_ratio = dropout_ratios[2]
            adj_matrix_dropped, node_matrix_dropped = aug.dropout_nodes(adj_matrix.copy(), node_matrix_rotated.copy(), dropout_ratio)
            # adj_matrix_add, node_matrix_add = add_nodes(adj_matrix.copy(), node_matrix_rotated.copy(), add_ratio)
            adj_matrix_dropped.to_csv(f"{save_path}/{gene}_adj_matrix.csv", index=False)
            node_matrix_dropped.to_csv(f"{save_path}/{gene}_node_matrix.csv", index=False)
            # aug.plot_graph(adj_matrix, node_matrix,adj_matrix_dropped, node_matrix_dropped, f"{cell}_{gene}", save_path)
        else:
            # print(f"The gene {gene} not need to drop out.")
            adj_matrix.to_csv(f"{save_path}/{gene}_adj_matrix.csv", index=False)
            node_matrix_rotated.to_csv(f"{save_path}/{gene}_node_matrix.csv", index=False)
            # aug.plot_graph(adj_matrix, node_matrix, adj_matrix, node_matrix_rotated, f"{cell}_{gene}_original", save_path)
Processing all cells: 100%|██████████| 701/701 [03:29<00:00, 3.34it/s]
3_GRASP training
step4: Load all TSGs to prepare for training
import pandas as pd
import gnn_model.gcn_cl as gcl
import gnn_model.graphloader as gra

dataset = "merfish_intestine_Enterocyte_resegment_new"
n_sectors = 30
m_rings = 15
k_neighbor = int((n_sectors * m_rings) / 10)

df = pd.read_csv(f"../3_filter/{dataset}/load_graph_data.csv")
print(df.shape)
cell_numbers = len(df['cell'].unique())
gene_numbers = len(df['gene'].unique())
print(f"cell_numbers:{cell_numbers} - gene_numbers:{gene_numbers}")

path = f"../4_partition_same/{dataset}_partition"

original_graphs, augmented_graphs = gra.generate_graph_data_target(dataset, df, path, n_sectors, m_rings, k_neighbor)
print(len(original_graphs))
print(len(augmented_graphs))

gene_labels = [data.gene for data in original_graphs]
cell_labels = [data.cell for data in original_graphs]
(4331, 2)
cell_numbers:688 - gene_numbers:58
Processing Graphs generate_graph_data_target: 100%|██████████| 4331/4331 [02:33<00:00, 28.19it/s]
4331
4331
graphs_number = len(original_graphs)
cell_numbers = len(df['cell'].unique())
gene_numbers = len(df['gene'].unique())
print(f"cell_numbers:{cell_numbers} - gene_numbers:{gene_numbers} - graphs_number:{graphs_number}")

save_path = f"../5_graph_data"
if not os.path.exists(save_path):
    os.makedirs(save_path)

graph_data = {"original_graphs": original_graphs,
              "augmented_graphs": augmented_graphs,
              "gene_labels": gene_labels,
              "cell_labels": cell_labels}
save_file = f"{save_path}/{dataset}_cell{cell_numbers}_gene{gene_numbers}_graph{graphs_number}.pkl"

with open(save_file, 'wb') as f:
    pickle.dump(graph_data, f)

print(f"Graph data saved to {save_file}")
cell_numbers:688 - gene_numbers:58 - graphs_number:4331
Graph data saved to ../5_graph_data/merfish_intestine_Enterocyte_resegment_new_cell688_gene58_graph4331.pkl
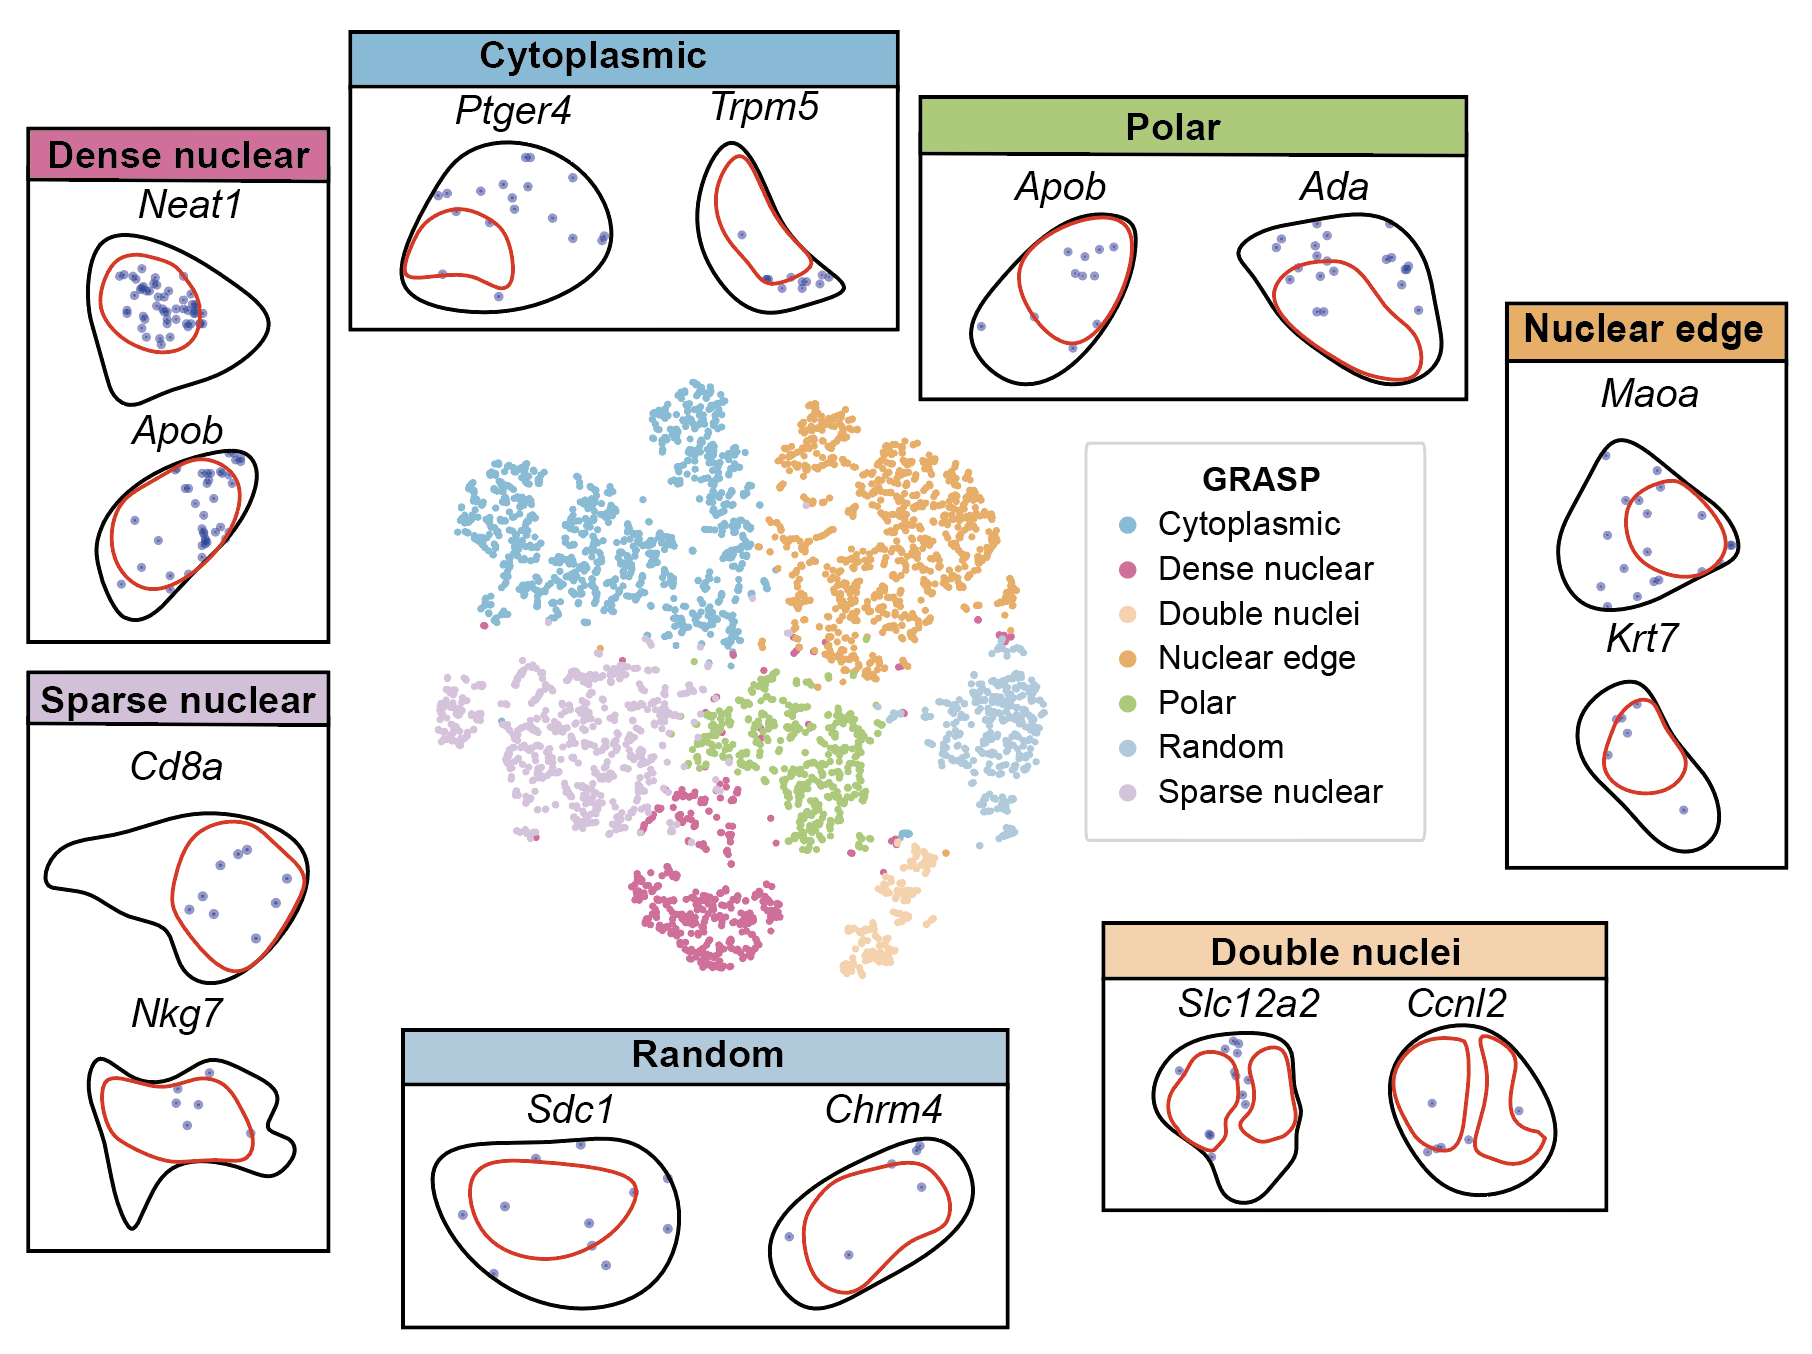
step5: Clustering and identifying spatial localization patterns
dataset = "merfish_intestine_Enterocyte_resegment"
a, b, epoch, lr, file = 0.3, 0.7, 300, 0.01, "0609_1521_bdb997"
out_path = f'../1.5_benchmark/method4_ours/{dataset}_{a}_{b}_{epoch}_{lr}_pca_ours_df_copy_graph.csv'
df = pd.read_csv(out_path)
plt.figure(figsize=(12, 8))
plt.subplot(2, 2, 1)
sns.scatterplot(x=df['tsne_x'], y=df['tsne_y'], hue=df['gmm_clusters7'], palette='Set1', s=5, legend=None)
plt.title(f"{dataset} TSNE")

plt.subplot(2, 2, 2)
sns.scatterplot(x=df['umap_x'], y=df['umap_y'], hue=df['gmm_clusters7'], palette='Set1', s=5)
plt.title(f"{dataset} UMAP")
plt.legend(bbox_to_anchor=(1.05, 1), loc='upper left')

plt.tight_layout()
plt.show()
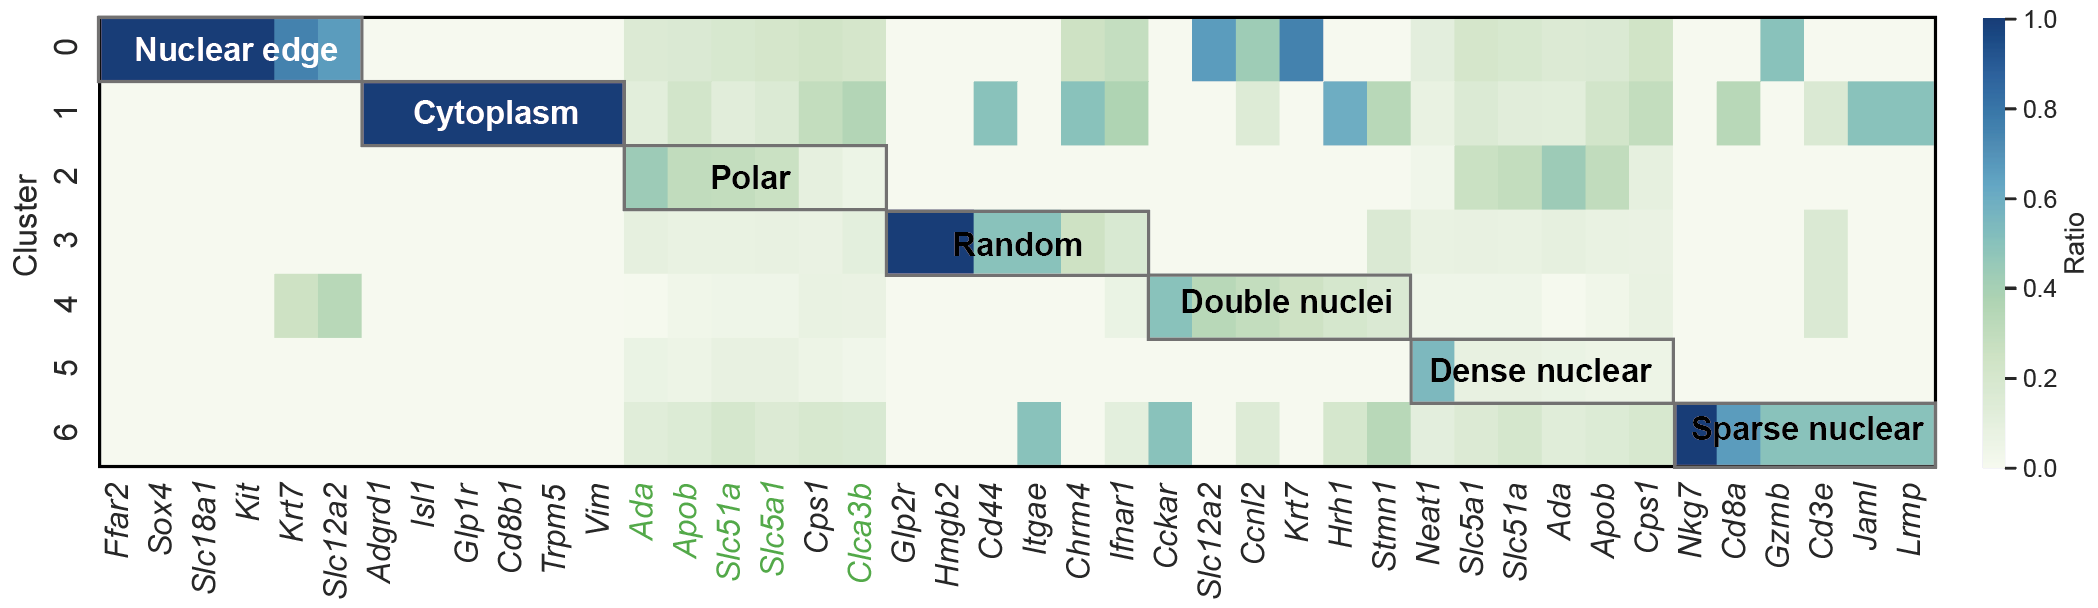
step6: Plot a TSG clustering heatmap
for method in method_list:
    df = pd.read_csv(f"../1.5_benchmark/method4_ours/{dataset}_0.3_0.7_300_0.01_pca_ours_df_copy_graph.csv")
    gene_cluster_counts = df.groupby(['gene', method]).size().unstack(fill_value=0)
    gene_cluster_ratio = gene_cluster_counts.div(gene_cluster_counts.sum(axis=1), axis=0)

    top_genes_per_cluster = {}
    for cluster in gene_cluster_ratio.columns:
        top_genes = gene_cluster_ratio[cluster].sort_values(ascending=False).head(100)
        top_genes_per_cluster[cluster] = top_genes.index.tolist()

    top_genes_df = pd.DataFrame(dict([(f'Cluster {c}', pd.Series(genes)) for c, genes in top_genes_per_cluster.items()]))

    # Define the lists of genes for each category
    list0 = top_genes_df['Cluster 0'][:6].tolist()
    list1 = top_genes_df['Cluster 1'][:6].tolist()
    list2 = top_genes_df['Cluster 2'][:6].tolist()
    list3 = top_genes_df['Cluster 3'][:6].tolist()
    list4 = top_genes_df['Cluster 4'][:6].tolist()
    list5 = top_genes_df['Cluster 5'][:6].tolist()
    list6 = top_genes_df['Cluster 6'][:6].tolist()
    genes_of_interest = list0 + list1 + list2 + list3 + list4 + list5 + list6

    # Prepare data for plotting
    df_selected = gene_cluster_ratio.loc[gene_cluster_ratio.index.intersection(genes_of_interest)]
    df_selected = df_selected.reindex(genes_of_interest)

    # --- New plotting code with annotation bar ---
    # 1. Define labels and colors for the bar
    cluster_labels = [
        "Nuclear periphery", "Cytoplasm", "Polar", "Random",
        "Double nuclei", "Dense nuclear", "Sparse nuclear"
    ]
    n_clusters = len(cluster_labels)
    genes_per_cluster = 6

    # Use predefined colors from color_map
    color_map = {
        'Nuclear periphery': '#fbb05b',
        'Cytoplasm': '#7bc4e2',
        'Polar': '#acd372',
        'Random': '#ACD0E4',
        'Double nuclei': '#FFD4AB',
        'Dense nuclear': '#ed6ca4',
        'Sparse nuclear': '#DDC4E0'
    }
    colors = [color_map[label] for label in cluster_labels]
    cmap = mcolors.ListedColormap(colors)

    # Create data for the color bar
    bar_data = np.array([[i] * genes_per_cluster for i in range(n_clusters)]).flatten().reshape(1, -1)

    # 2. Create subplots: one for heatmap, one for the bar
    fig, (ax_heatmap, ax_bar) = plt.subplots(
        2, 1,
        figsize=(18, 6),
        sharex=True,
        gridspec_kw={'height_ratios': [10, 1], 'hspace': 0.05}
    )

    # 3. Plot the heatmap on the top subplot
    sns.set(font_scale=1.2)
    sns.heatmap(df_selected.T, annot=False, cmap="GnBu", cbar_kws={"label": "Ratio"}, ax=ax_heatmap)
    ax_heatmap.set_title(f"Gene distribution across {method}", fontsize=14)
    ax_heatmap.set_ylabel("Cluster", fontsize=12)
    ax_heatmap.set_xlabel("")

    # 4. Plot the annotation bar on the bottom subplot
    ax_bar.imshow(bar_data, cmap=cmap, interpolation='nearest', aspect='auto')

    # Configure the ticks and labels for the bar
    ax_bar.set_yticks([])
    tick_locs = [genes_per_cluster * i + genes_per_cluster / 2 - 0.5 for i in range(n_clusters)]
    ax_bar.set_xticks(tick_locs)
    ax_bar.set_xticklabels(cluster_labels, fontsize=11, rotation=0, ha='center')

    # 5. Adjust layout and save the figure
    plt.tight_layout(rect=[0, 0.01, 1, 0.98])

    plt.savefig(f"{figure_dir}/heatmap_with_bar_{method}.svg", bbox_inches='tight')
    plt.show()