04_MERFISH_U2OS_cell_line
1_dataset details
| Dataset | Cell number | Gene number | TSGs | Pattern |
|---|---|---|---|---|
| merfish_u2os | 989 | 130 | 123375 | —— |
| merfish_u2os(group1) | 621 | 9 | 947 | 6 |
| merfish_u2os(group2) | 634 | 25 | 1000 | 5 |
| merfish_u2os(group3) | 621 | 25 | 1000 | 6 |
| merfish_u2os(group4) | 629 | 25 | 1000 | 7 |
| merfish_u2os(group5) | 989 | 25 | 23242 | 8 |
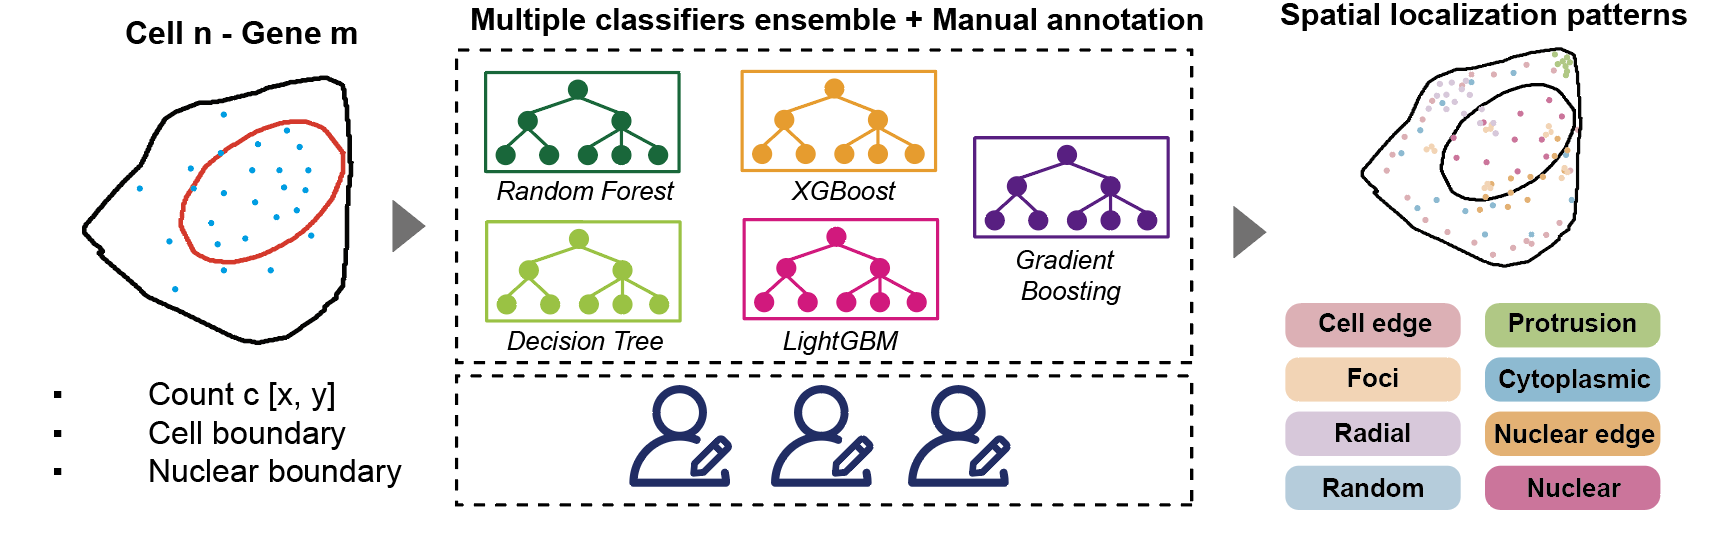
How are labels annotated?
The labels were generated through a semi-automated pipeline that combined predictions from five trained classifiers (LightGBM, Random Forest, XGBoost, Gradient Boosting, and Decision Tree) on simulated data, followed by manual refinement. This approach accurately annotated 23,242 transcript spots from 25 selected genes, with results consistent with known localization patterns (e.g., nuclear genes like MALAT1 labeled correctly, and secreted proteins like THBS1 assigned to the nuclear membrane). The integration of computational and manual validation ensured high-confidence pseudo-labels for the unannotated dataset.
2_GRASP preprocessing
step1: Load data
dataset = "merfish_u2os_group1"
outfile = f'../1_input/pkl_data/{dataset}_data_dict.pkl'

with open(outfile, 'rb') as f:
    pickle_dict = pickle.load(f)

df_registered = pickle_dict['df_registered']
cell_radii = pickle_dict['cell_radii']
cell_boundary = pickle_dict['cell_boundary']
nuclear_boundary = pickle_dict['nuclear_boundary']
nuclear_boundary_df_registered = pickle_dict['nuclear_boundary_df_registered']
step2: Visualize the original and normalized TSGs
path = "../2_scaled_cell"
cep.plot_raw_gene_distribution(dataset, cell_boundary, nuclear_boundary, df_registered, path)
cep.plot_register_gene_distribution(dataset, df_registered, path, nuclear_boundary_df_registered)
step3: Cell partitioning
import utils_code.partition as pat

gene_list = df_registered['gene'].unique()
cell_list = df_registered['cell'].unique()
dir = f"../4_partition_same/{dataset}_partition/"
if not os.path.exists(dir):
    os.makedirs(dir)
for n_sectors in range(30, 31, 10):
    for m_rings in range(15, 16, 5):
        for target_cell in cell_list:
            df = df_registered[df_registered['cell'] == target_cell]
            genes = df['gene'].unique()
            k_neighbor = int((n_sectors * m_rings) / 10)
            plot_dir = os.path.join(dir,f"{target_cell}/{target_cell}_{n_sectors}_{m_rings}_k{k_neighbor}")
            if not os.path.exists(plot_dir):
                os.makedirs(plot_dir)
            print(f"This is [target_cell: {target_cell}] - [n_sectors: {n_sectors}] - [m_rings: {m_rings}], and k_neighbor is {k_neighbor}")
            nuclear_boundary_df = nuclear_boundary_df_registered[nuclear_boundary_df_registered['cell'] == target_cell]
            for gene in tqdm(gene_list, desc="Processing genes"):
                df_filtered = df[df['gene'] == gene]
                r = 1
                count_matrix, center_points, point_counts, is_virtual, is_edge = pat.count_points_in_areas_same(df_filtered, n_sectors, m_rings, r)
                nuclear_positions = pat.classify_center_points_with_edge(center_points, nuclear_boundary_df, is_edge)
                edges = pat.build_graph_k_nearest(center_points, k=k_neighbor)
                G = pat.build_graph_with_networkx(center_points, edges, is_virtual)
                pat.save_node_data_to_csv_old(center_points, is_virtual, plot_dir, gene, point_counts, k=k_neighbor, nuclear_positions=nuclear_positions)
                pat.plot_cell_partition_heatmap(target_cell, gene, point_counts, n_sectors, m_rings, r, plot_dir, nuclear_boundary_df)
step4: Enhancement of TSGs
import utils_code.augumentation as aug

n_sectors = 30
m_rings = 15
k_neighbor = int((n_sectors * m_rings) / 10)
dropout_ratios = [0.1, 0.2, 0.3]

dir = f"../4_partition_same/{dataset}_partition/"
gene_list = df_registered['gene'].unique()
cell_list = df_registered['cell'].unique()

for cell in tqdm(cell_list, desc="Processing all cells", leave=True):
    path = f"{dir}/{cell}/{cell}_{n_sectors}_{m_rings}_k{k_neighbor}"
    save_path = f"{dir}/{cell}/{cell}_{n_sectors}_{m_rings}_k{k_neighbor}_aug"
    if not os.path.exists(save_path):
        os.makedirs(save_path)
    for gene in tqdm(gene_list, desc="Processing all genes", leave=True):
        nodes_file = f'{path}/{gene}_node_matrix.csv'
        adj_file = f'{path}/{gene}_adj_matrix.csv'
        if not os.path.exists(nodes_file) or not os.path.exists(adj_file):
            print(f"Skipping {gene} in {cell} (file not found).")
            continue
        node_matrix = pd.read_csv(nodes_file)
        adj_matrix = pd.read_csv(adj_file)
        random_angle = random.uniform(0, 360)
        # print(random_angle)
        node_matrix_rotated = aug.rotate_nodes(node_matrix.copy(), random_angle)
        real_nodes_count = (node_matrix_rotated['is_virtual'] == 0).sum()
        if real_nodes_count >= 10:
            if real_nodes_count <= 100:
                dropout_ratio = dropout_ratios[0]
            elif real_nodes_count > 100 and real_nodes_count <= 150:
                dropout_ratio = dropout_ratios[1]
            else:
                dropout_ratio = dropout_ratios[2]
            adj_matrix_dropped, node_matrix_dropped = aug.dropout_nodes(adj_matrix.copy(), node_matrix_rotated.copy(), dropout_ratio)
            adj_matrix_dropped.to_csv(f"{save_path}/{gene}_adj_matrix.csv", index=False)
            node_matrix_dropped.to_csv(f"{save_path}/{gene}_node_matrix.csv", index=False)
        else:
            adj_matrix.to_csv(f"{save_path}/{gene}_adj_matrix.csv", index=False)
            node_matrix_rotated.to_csv(f"{save_path}/{gene}_node_matrix.csv", index=False)
3_GRASP training
step5: Load all TSGs to prepare for training
cell_list = df_registered['cell'].unique()
gene_list = df_registered['gene'].unique()
cell_numbers = len(cell_list)
gene_numbers = len(gene_list)

n_sectors = 30
m_rings = 15
k_neighbor = int((n_sectors * m_rings) / 10)

path = f"../4_partition_same/{dataset}_partition"
df = pd.read_csv(f"../1_input/label/{dataset}_label.csv")
original_graphs, augmented_graphs = gra.generate_graph_data_target(dataset, df, path, n_sectors, m_rings, k_neighbor)

print(len(original_graphs))
print(len(augmented_graphs))

gene_labels = [data.gene for data in original_graphs]
cell_labels = [data.cell for data in original_graphs]
Processing Graphs: 100%|██████████| 947/947 [3:22<00:00, 7.49it/s]
graphs_number = len(original_graphs)
print(f"cell_numbers:{cell_numbers} - gene_numbers:{gene_numbers} - graphs_number:{graphs_number}")

save_path = f"../5_graph_data"
if not os.path.exists(save_path):
    os.makedirs(save_path)

graph_data = {"original_graphs": original_graphs,
              "augmented_graphs": augmented_graphs,
              "gene_labels": gene_labels,
              "cell_labels": cell_labels}

save_file = f"{save_path}/{dataset}_cell{cell_numbers}_gene{gene_numbers}_graph{graphs_number}.pkl"
with open(save_file, 'wb') as f:
    pickle.dump(graph_data, f)

print(f"Graph data saved to {save_file}")
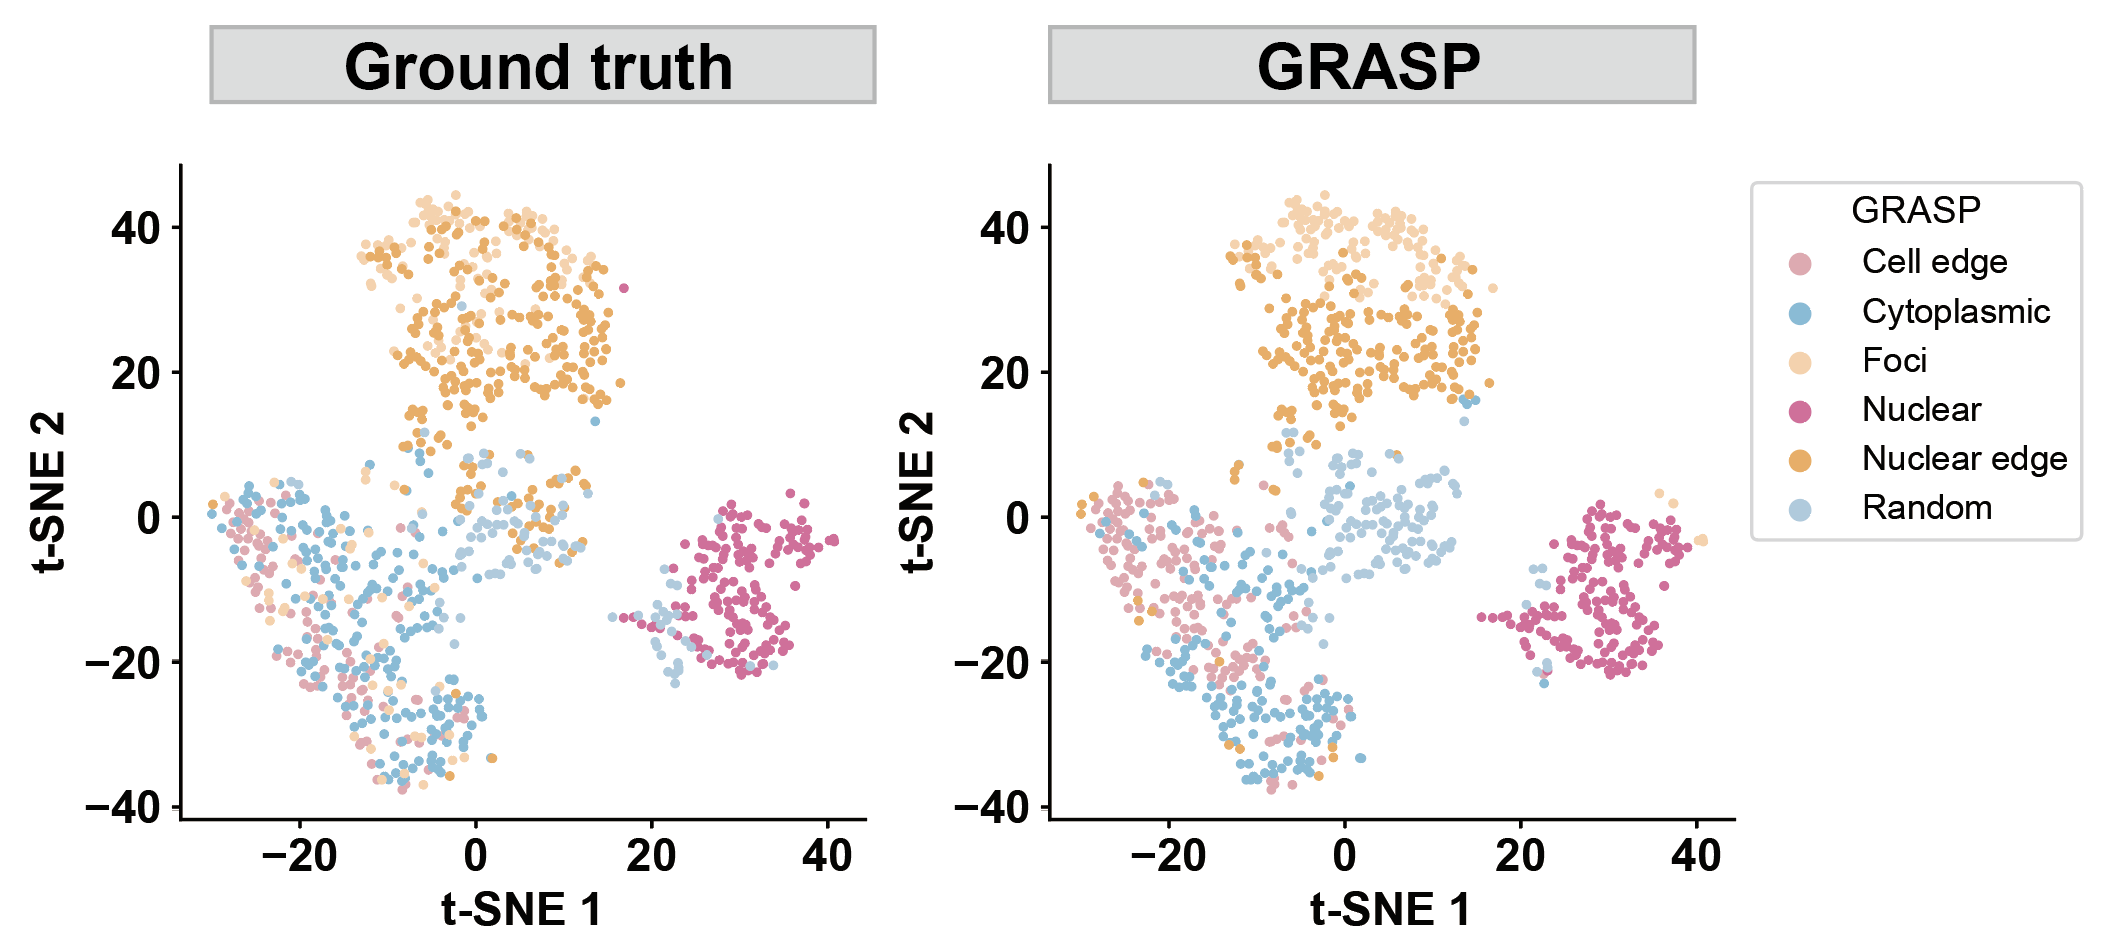
step6: Clustering and identifying spatial localization patterns
color_map = {'Nuclear':'#ed6ca4', 'Cytoplasmic': '#7bc4e2', 'Protrusion': '#acd372', 'Nuclear edge':'#fbb05b',
             'Cell edge': '#EDABB5', 'Random':'#ACD0E4', 'Foci':'#FFD4AB', 'Radial':'#DDC4E0'}


def plot_tsne(data, label_col, title, legend_title, save_name):
    plt.figure(figsize=(6, 4))
    for label, group in data.groupby(label_col):
        plt.scatter(x=group['tsne_x'], y=group['tsne_y'], color=color_map[label], label=label, s=5)

    ax = plt.gca()
    ax.spines['top'].set_visible(False)
    ax.spines['right'].set_visible(False)
    ax.spines['left'].set_linewidth(1)
    ax.spines['bottom'].set_linewidth(1)
    ax.xaxis.set_major_locator(MultipleLocator(20))
    ax.yaxis.set_major_locator(MultipleLocator(20))
    ax.tick_params(axis='x', which='both', direction='out', length=3, width=1, color='black', top=False, bottom=True, labelsize=16)
    ax.tick_params(axis='y', which='both', direction='out', length=3, width=1, color='black', right=False, left=True, labelsize=16)
    for label in ax.get_xticklabels():
        label.set_fontweight('bold')
    for label in ax.get_yticklabels():
        label.set_fontweight('bold')
    plt.grid(False)
    plt.legend(title=legend_title, frameon=True, fontsize=12, title_fontsize=13, markerscale=3.0, bbox_to_anchor=(1, 1), loc='upper left')
    plt.title(title, fontsize=16)
    plt.xlabel('t-SNE 1', fontsize=16,fontweight='bold')
    plt.ylabel('t-SNE 2', fontsize=16,fontweight='bold')
    plt.tight_layout()
    for ext in ['png', 'pdf', 'svg']:
        plt.savefig(f'{save_name}.{ext}', bbox_inches='tight', dpi=300)
    plt.show()
dataset = "merfish_u2os_group4"
params_list = [(0.2, 0.8)]
for a, b in params_list:
    path1 = f'../1.5_benchmark/figure/{dataset}/s1_tsne_ours_a{a}_b{b}'
    path2 = f'../1.5_benchmark/figure/{dataset}/s1_tsne_gt_a{a}_b{b}'
    our_label = pd.read_csv(f'../1.5_benchmark/method4_ours/{dataset}/ours_label_a{a}_b{b}.csv')
    plot_tsne(data=our_label, label_col='pattern', title='', legend_title='GRASP', save_name=path1)
    plot_tsne(data=our_label, label_col='groundtruth_wzx', title='', legend_title='Ground truth', save_name=path2)
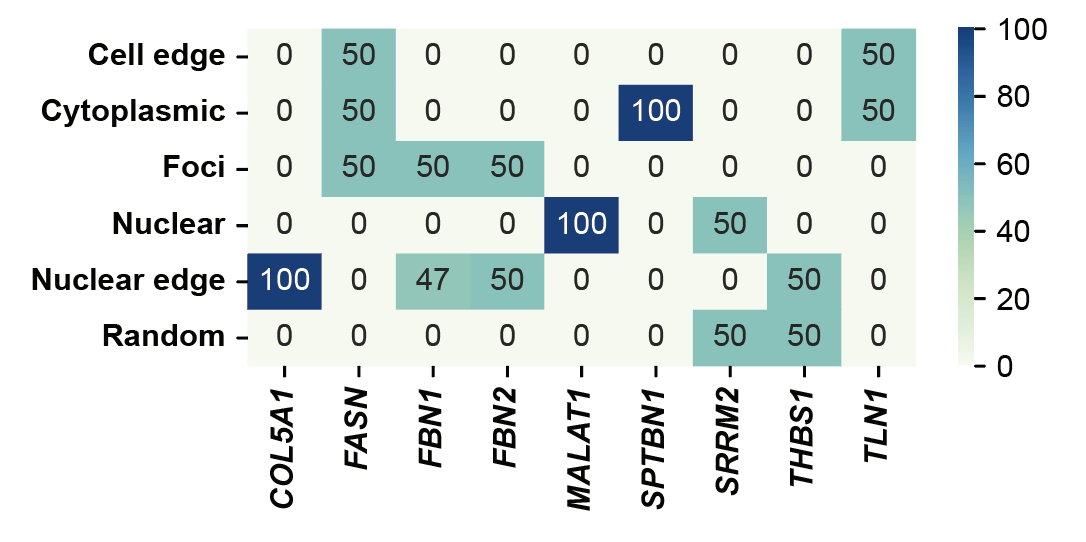
step7: Statistical data distribution
for group in ['group1']:
    tmp = pd.read_csv(f"../7_classifier/predicted/sampled_data_{group}.csv")

    gene_label_counts = pd.crosstab(tmp['gene'], tmp['groundtruth_wzx'])
    fig, ax = plt.subplots(figsize=(5, 2.5))
    sns.heatmap(gene_label_counts.T, annot=True, fmt='d', cmap='GnBu')
    ax.set_xlabel('')
    ax.set_ylabel('')
    ax.tick_params(axis='x', labelsize=10)
    ax.tick_params(axis='y', labelsize=10)
    for label in ax.get_xticklabels():
        label.set_fontweight('bold')
    for label in ax.get_yticklabels():
        label.set_fontweight('bold')
    plt.tight_layout()
    plt.show()
step8: Analyze individual genes
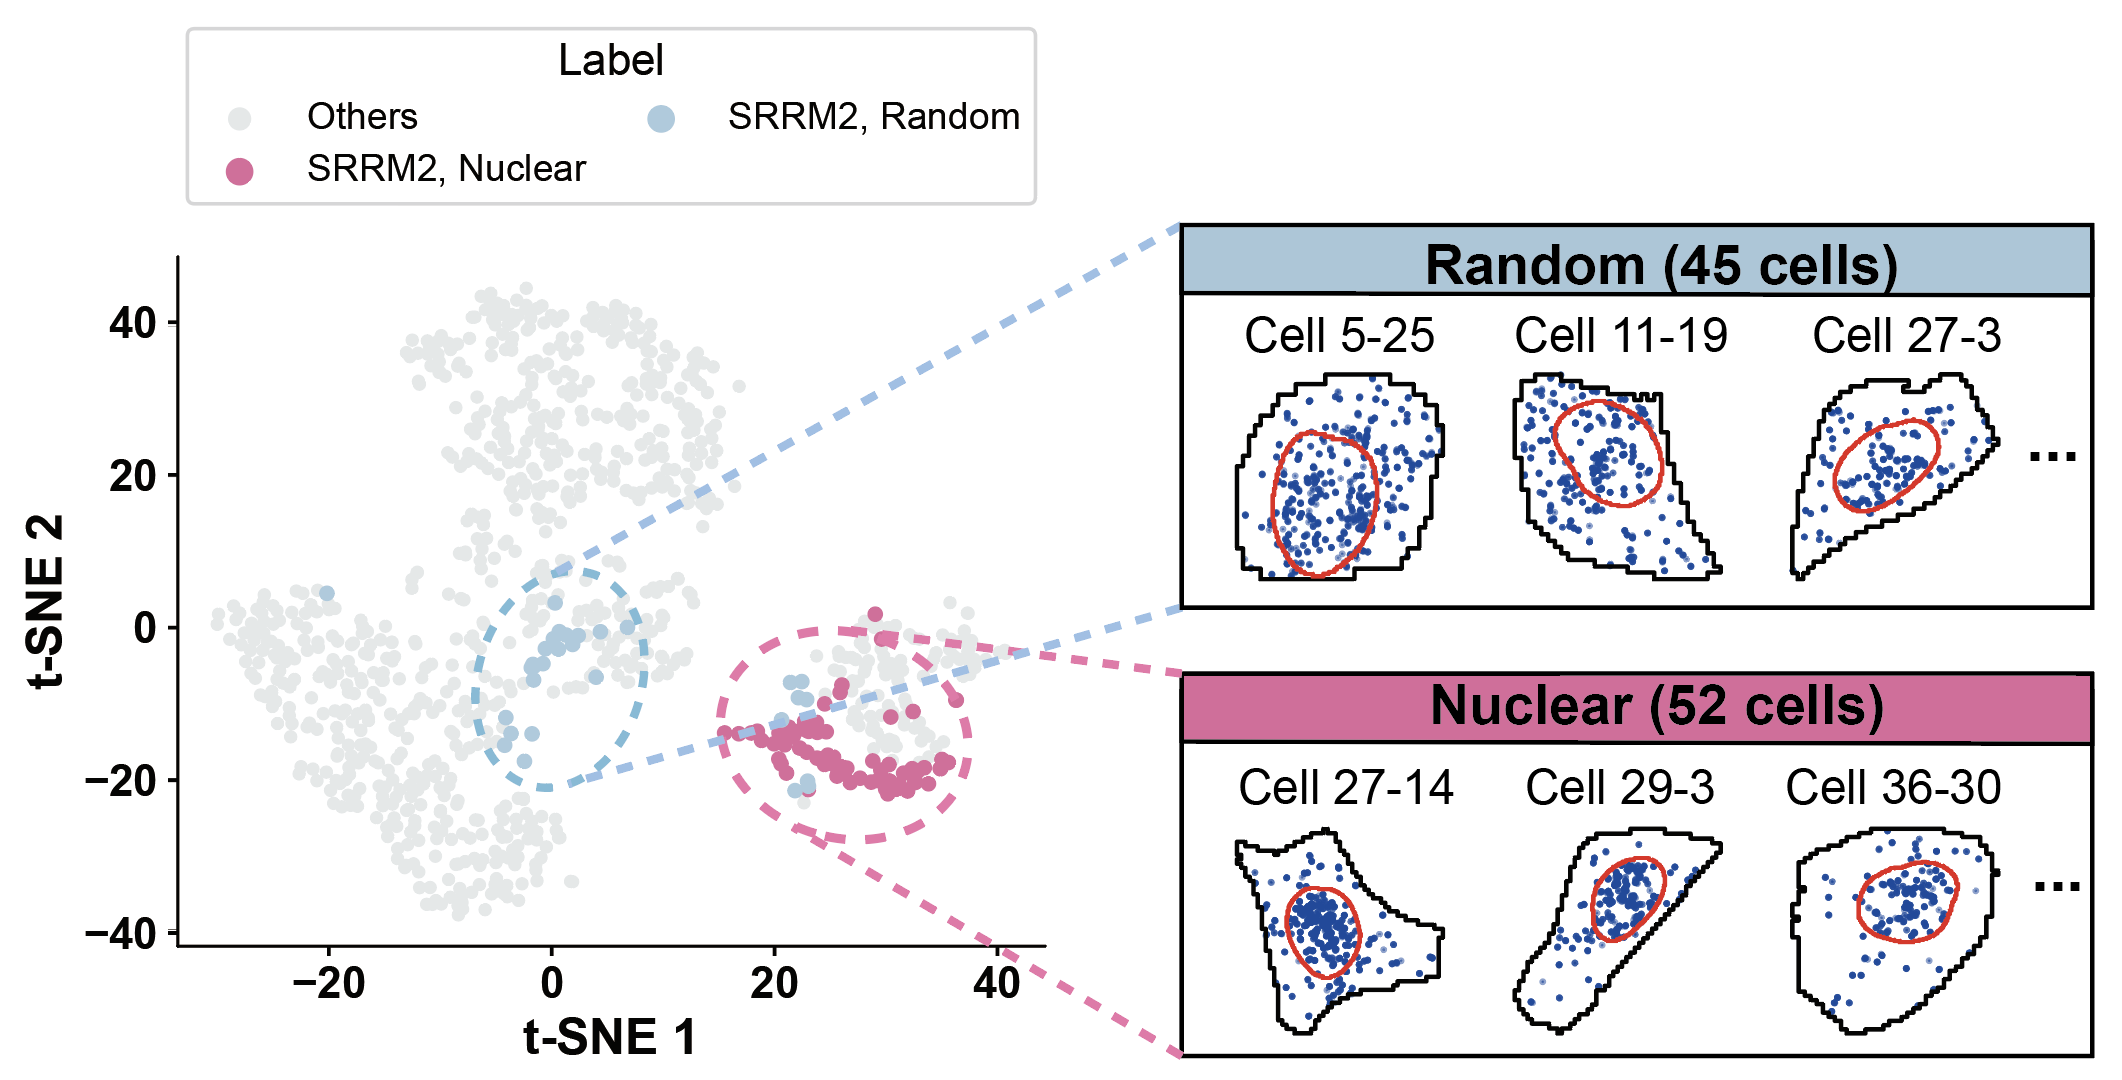
def plot_gene_tsne(gene, pattern1='Nuclear', pattern2='Random', a=0.2, b=0.8,
                   dataset="merfish_u2os_group4", save_path="../1.5_benchmark/figure"):

    df = pd.read_csv(f"../1.5_benchmark/method4_ours/{dataset}/ours_label_a{a}_b{b}.csv")
    color_map = {'Nuclear': '#ed6ca4', 'Cytoplasmic': '#7bc4e2','Protrusion': '#acd372', 'Nuclear edge':'#fbb05b',
             'Cell edge': '#EDABB5', 'Random':'#ACD0E4', 'Foci':'#FFD4AB', 'Radial':'#DDC4E0'}

    cond1 = (df['gene'] == gene) & (df['pattern'] == pattern1)
    cond2 = (df['gene'] == gene) & (df['pattern'] == pattern2)
    cond_gray = ~ (cond1 | cond2)

    # 统计信息
    patterns = ['Nuclear edge', 'Random', 'Cytoplasmic', 'Cell edge', 'Nuclear','Foci']
    for pattern in patterns:
        count = df[(df['gene'] == gene) & (df['pattern'] == pattern)].shape[0]
        print(f"{gene} - {pattern}: {count} cells")

    # 绘图
    plt.figure(figsize=(5, 4))
    plt.scatter(df.loc[cond_gray, 'tsne_x'], df.loc[cond_gray, 'tsne_y'],
                color='#e5e9ea', label='Others', s=10)
    for cond, label in [(cond1, f'{gene}, {pattern1}'), (cond2, f'{gene}, {pattern2}')]:
        if cond.any():
            pattern_type = df.loc[cond, 'pattern'].iloc[0]
            color = color_map.get(pattern_type, '#000000')
            plt.scatter(df.loc[cond, 'tsne_x'], df.loc[cond, 'tsne_y'], color=color, label=label, s=15)

    # 坐标轴设置
    ax = plt.gca()
    ax.spines['top'].set_visible(False)
    ax.spines['right'].set_visible(False)
    ax.spines['left'].set_visible(True)
    ax.spines['bottom'].set_visible(True)
    ax.xaxis.set_major_locator(MultipleLocator(20))
    ax.yaxis.set_major_locator(MultipleLocator(20))
    ax.tick_params(axis='x', which='both', direction='out', length=3, width=1, color='black', top=False, bottom=True, labelsize=14)
    ax.tick_params(axis='y', which='both', direction='out', length=3, width=1, color='black', right=False, left=True, labelsize=14)
    for label in ax.get_xticklabels():
        label.set_fontweight('bold')
    for label in ax.get_yticklabels():
        label.set_fontweight('bold')
    plt.grid(False)
    ax.legend(title='Label', fontsize=12, title_fontsize=14, markerscale=2.0, loc='lower center', bbox_to_anchor=(0.5, 1.05), columnspacing=1, ncol=2, frameon=True)
    plt.xlabel('t-SNE 1', fontsize=16, fontweight='bold')
    plt.ylabel('t-SNE 2', fontsize=16, fontweight='bold')
    output_prefix = f"{save_path}/{dataset}/s5_merfish_{gene}"
    plt.savefig(f"{output_prefix}.png", dpi=300, bbox_inches='tight')
    plt.savefig(f"{output_prefix}.pdf", bbox_inches='tight')
    plt.savefig(f"{output_prefix}.svg", bbox_inches='tight')
    plt.show()
plot_gene_tsne(gene='SRRM2', pattern1='Nuclear', pattern2='Random')
SRRM2 - Nuclear edge: 0 cells
SRRM2 - Random: 30 cells
SRRM2 - Cytoplasmic: 1 cells
SRRM2 - Cell edge: 2 cells
SRRM2 - Nuclear: 67 cells
SRRM2 - Foci: 0 cells
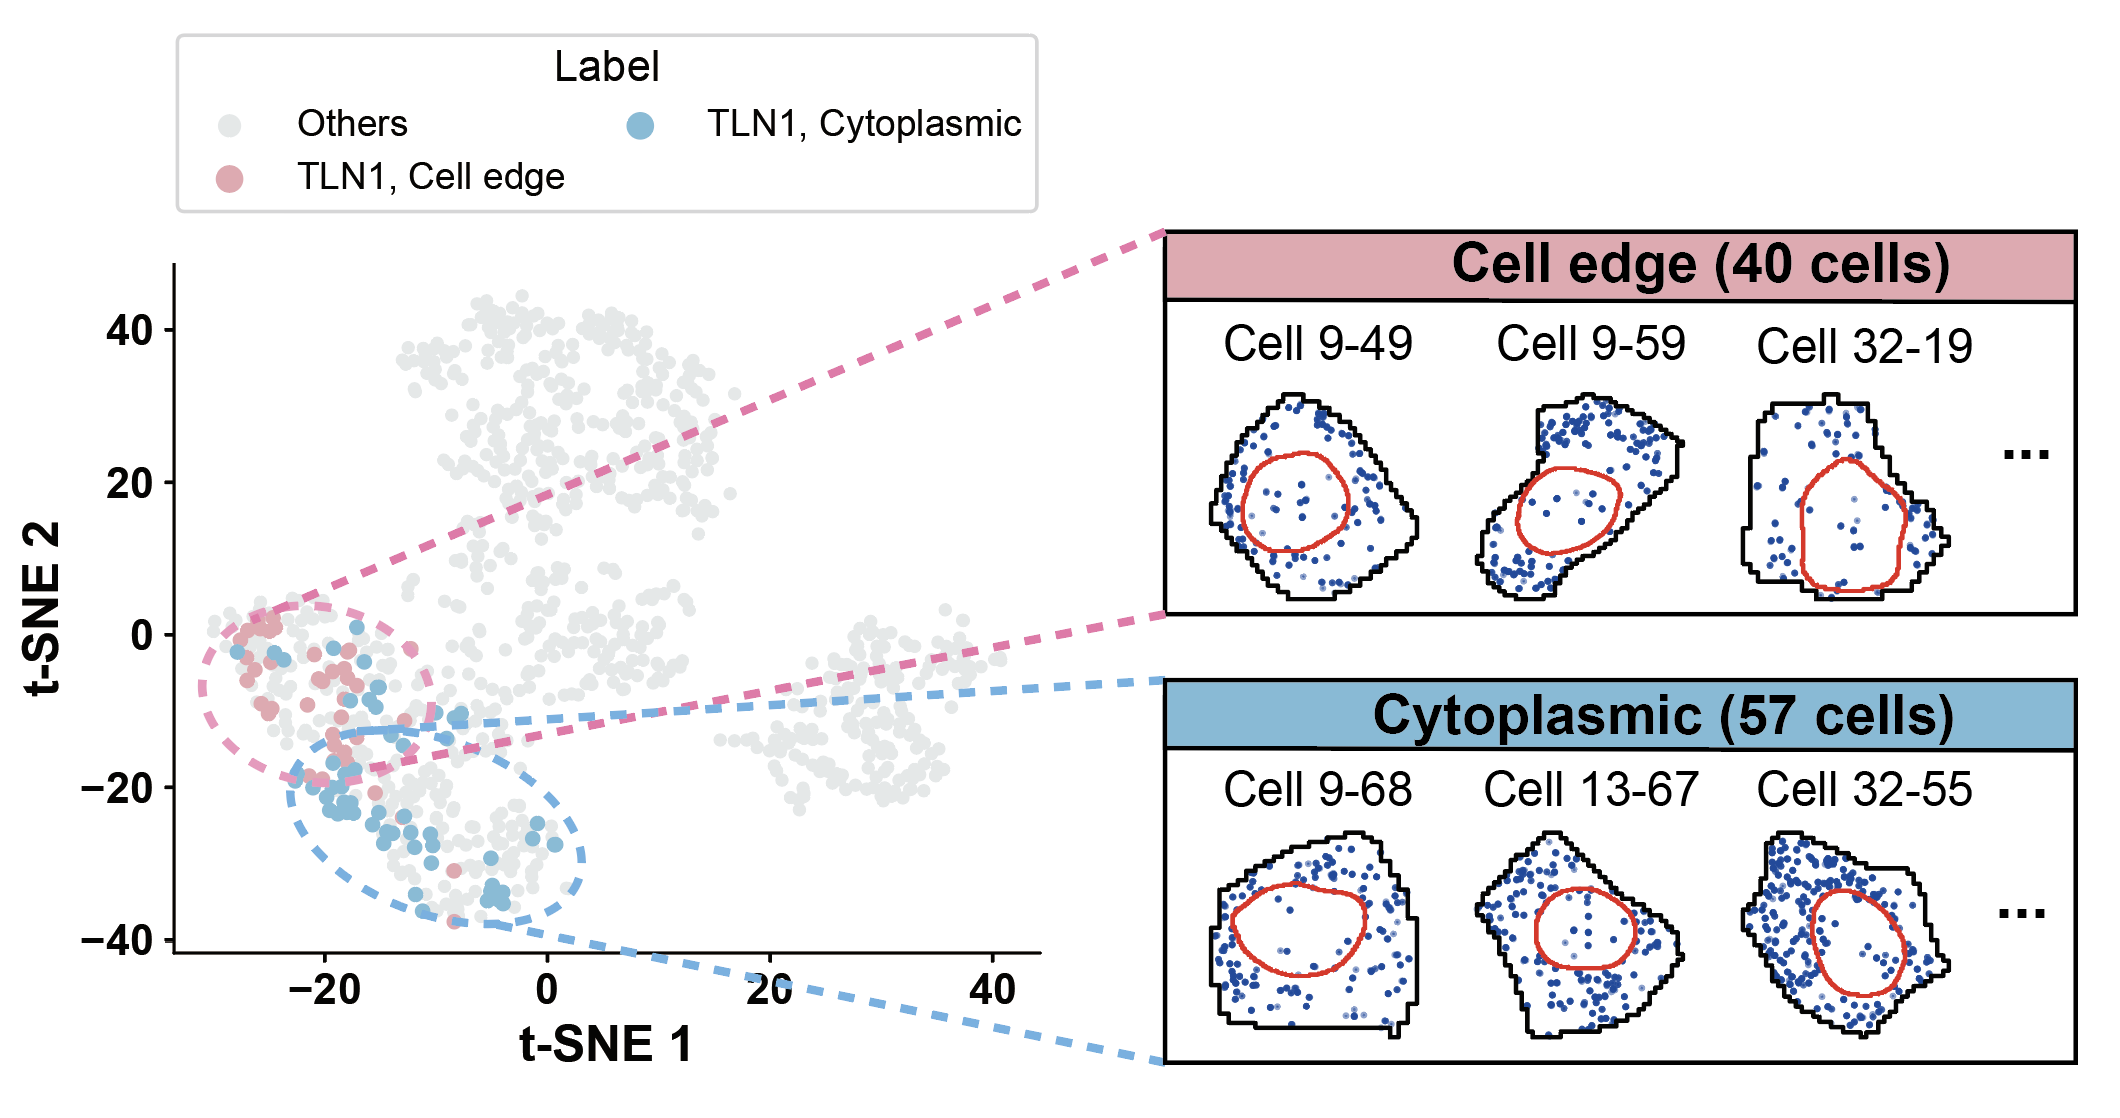
plot_gene_tsne(gene='TLN1', pattern1='Cell edge', pattern2='Cytoplasmic')
TLN1 - Nuclear edge: 2 cells
TLN1 - Random: 1 cells
TLN1 - Cytoplasmic: 57 cells
TLN1 - Cell edge: 40 cells
TLN1 - Nuclear: 0 cells
TLN1 - Foci: 0 cells
a, b= 0.2, 0.8
dataset = "merfish_u2os_group4"
df = pd.read_csv(f"../1.5_benchmark/method4_ours/{dataset}/ours_label_a{a}_b{b}.csv")
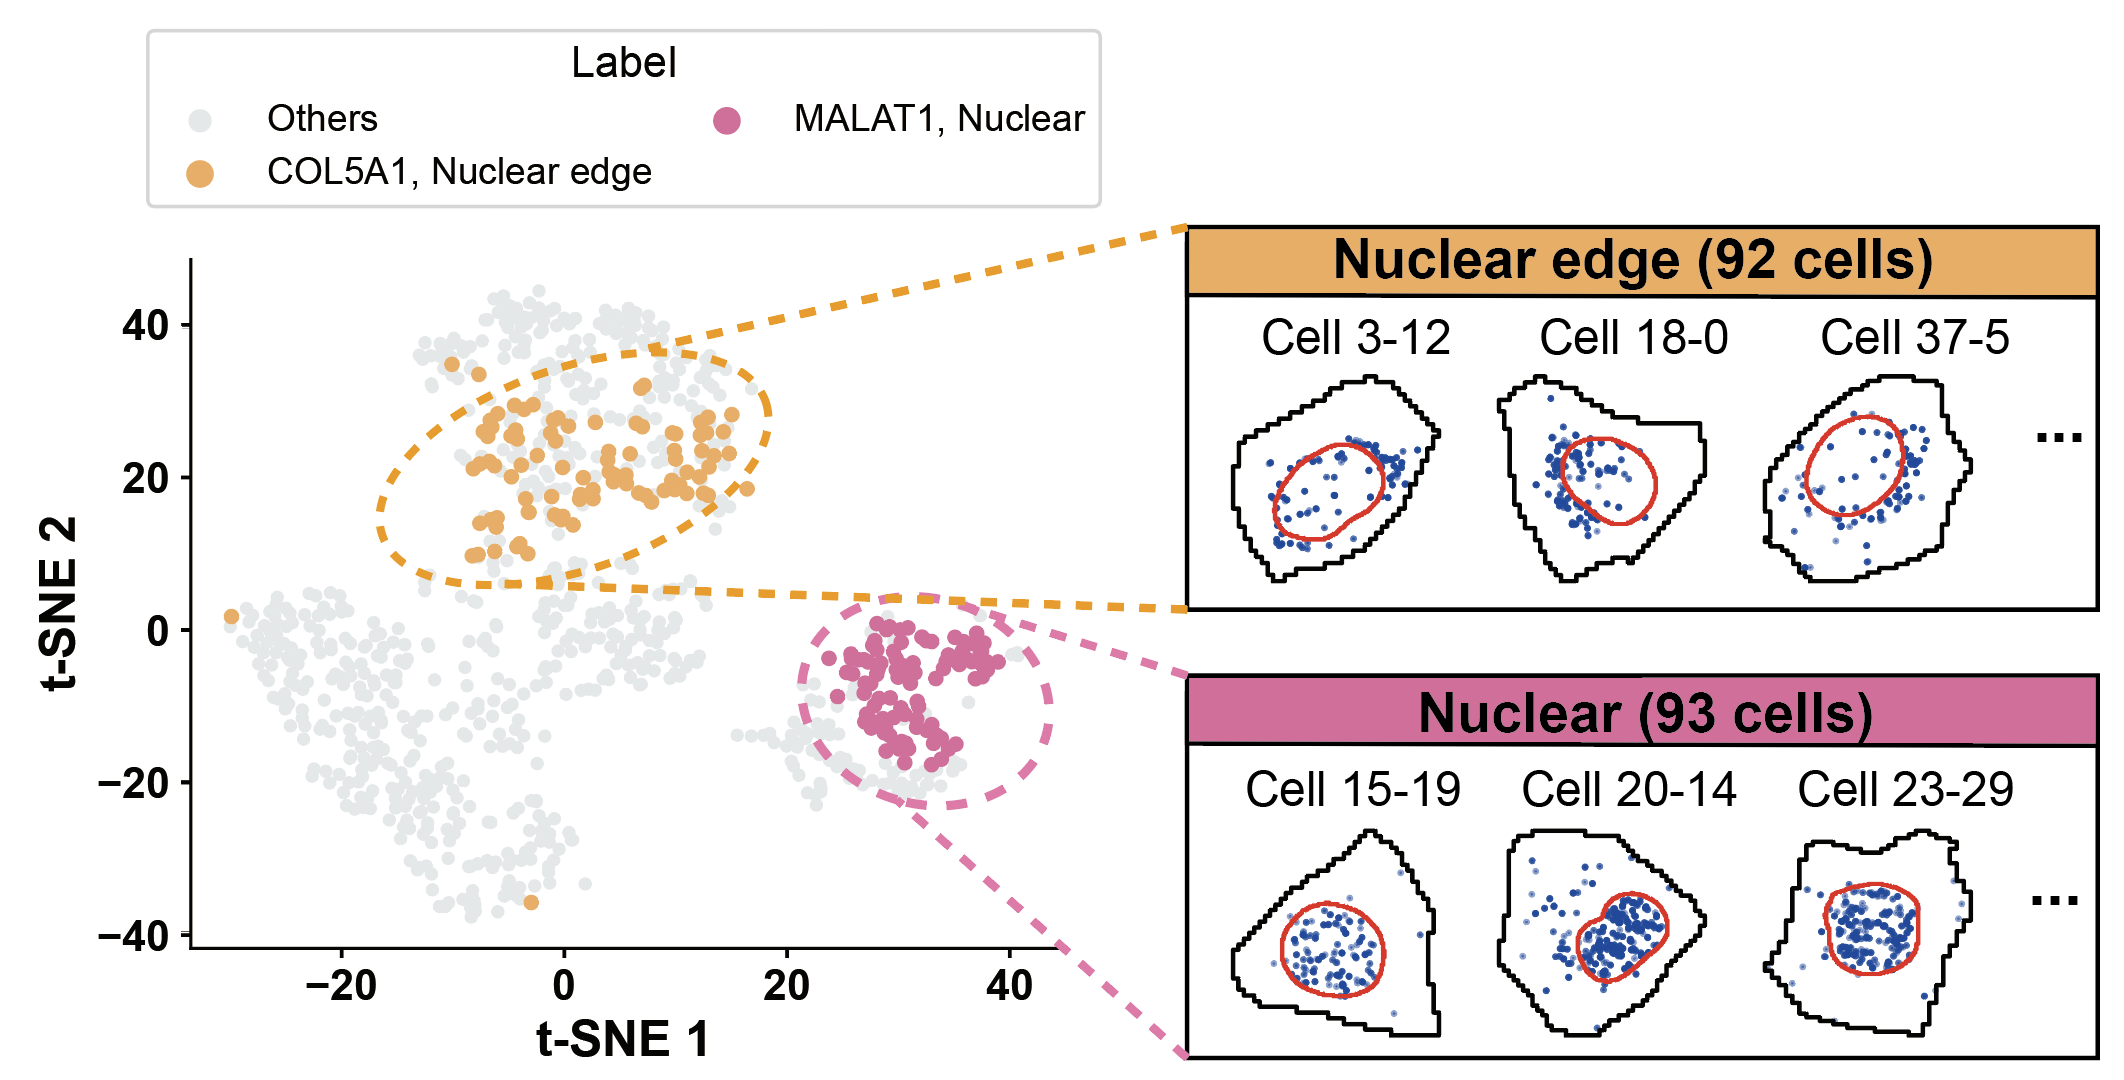
gene1, pattern1 = "COL5A1", "Nuclear edge"
gene2, pattern2 = "MALAT1", "Nuclear"
gene3, pattern3 = "SPTBN1", "Cytoplasmic"
cond_red = (df['gene'] == gene1) & (df['pattern'] == pattern1)
cond_green = (df['gene'] == gene2) & (df['pattern'] == pattern2)
cond_blue = (df['gene'] == gene3) & (df['pattern'] == pattern3)
cond_gray = ~ (cond_red | cond_green | cond_blue)
count = df[(df['gene'] == gene1) & (df['pattern'] == pattern1)].shape[0]
print(f"{gene1} - {pattern1}: {count} cells")
count = df[(df['gene'] == gene2) & (df['pattern'] == pattern2)].shape[0]
print(f"{gene2} - {pattern2}: {count} cells")
count = df[(df['gene'] == gene3) & (df['pattern'] == pattern3)].shape[0]
print(f"{gene3} - {pattern3}: {count} cells")
# 创建画布
plt.figure(figsize=(5, 4))
plt.scatter(df.loc[cond_gray, 'tsne_x'], df.loc[cond_gray, 'tsne_y'], color='#e5e9ea', label='Others',s=10)
plt.scatter(df.loc[cond_red, 'tsne_x'], df.loc[cond_red, 'tsne_y'], color='#fbb05b', label=f'{gene1}, {pattern1}',s=15)
plt.scatter(df.loc[cond_green, 'tsne_x'], df.loc[cond_green, 'tsne_y'], color='#ed6ca4', label=f'{gene2}, {pattern2}',s=15)
ax = plt.gca()
ax.spines['top'].set_visible(False)
ax.spines['right'].set_visible(False)
ax.spines['left'].set_visible(True)
ax.spines['bottom'].set_visible(True)
ax.xaxis.set_major_locator(MultipleLocator(20))
ax.yaxis.set_major_locator(MultipleLocator(20))
ax.tick_params(axis='x', which='both', direction='out', length=3, width=1, color='black', top=False, bottom=True, labelsize=14)
ax.tick_params(axis='y', which='both', direction='out', length=3, width=1, color='black', right=False, left=True, labelsize=14)
for label in ax.get_xticklabels():
label.set_fontweight('bold')
for label in ax.get_yticklabels():
label.set_fontweight('bold')
plt.grid(False)
ax.legend(title='Label', fontsize=12, title_fontsize=14, markerscale=2.0, loc='lower center', bbox_to_anchor=(0.5, 1.05),
columnspacing=1, ncol=2, frameon=True)
plt.xlabel('t-SNE 1', fontsize=16, fontweight='bold')
plt.ylabel('t-SNE 2', fontsize=16, fontweight='bold')
plt.savefig(f'../1.5_benchmark/figure/{dataset}/merfish_three.png', dpi=300, bbox_inches='tight')
plt.savefig(f'../1.5_benchmark/figure/{dataset}/merfish_three.pdf', bbox_inches='tight')
plt.savefig(f'../1.5_benchmark/figure/{dataset}/merfish_three.svg', bbox_inches='tight')
plt.show()
COL5A1 - Nuclear edge: 92 cells
MALAT1 - Nuclear: 93 cells
SPTBN1 - Cytoplasmic: 48 cells